Eighteen months of receipts: how Humira's biosimilar curve broke the rebate model
Humira lost patent exclusivity in July 2023. Nine biosimilars launched. Industry consensus, public analyst forecasts, and every prior small-molecule LOE precedent pointed to the same outcome: 40 to 60 percent biosimilar share within eighteen months. Humira biosimilars hit 4.5 percent of Medicare Part D adalimumab beneficiaries by year-end 2023.
19.2%
Q3 2025 biosimilar share
$2.11B
Big 3 PBM Schedule C, 2023
$224.8M
Ohio PBM spread retained, 2017-2018 audit
This post is about the eighteen-month gap that followed, and what closed it. The work was done in Claude Desktop with Medistill loaded as a research backend. Every query is reproducible. The actual prompts are pasted inline so you can run them yourself. The data is public, the receipts are quarterly, and the conclusion is uncomfortable.
The framing matters. This isn't about whether PBMs retain rebates. They do, it's their business model, and that's not contested. It's about whether the retention model produces market outcomes that match consensus theory of competition. The Humira biosimilar adoption curve from July 2023 through September 2025 is the cleanest controlled experiment we have. The receipts say no.
Setting up the question
The first thing you ask any new dataset is the boring question that tells you whether the trend you think exists actually exists.
Prompt 1:
> Pull annual Part D spending on Humira and adalimumab biosimilars from 2019 through the most recent closed year. Total spend, beneficiary count, per-beneficiary spend by year. Table format.
The Medistill query returns the closed-annual series. From 2019 to 2023, Humira Part D spend climbed from $1.2B to $4.4B. The beneficiary count was relatively stable. Per-bene spend went from approximately $37,000 to $72,000 over that window. Unit price CAGR was 9.2 percent.
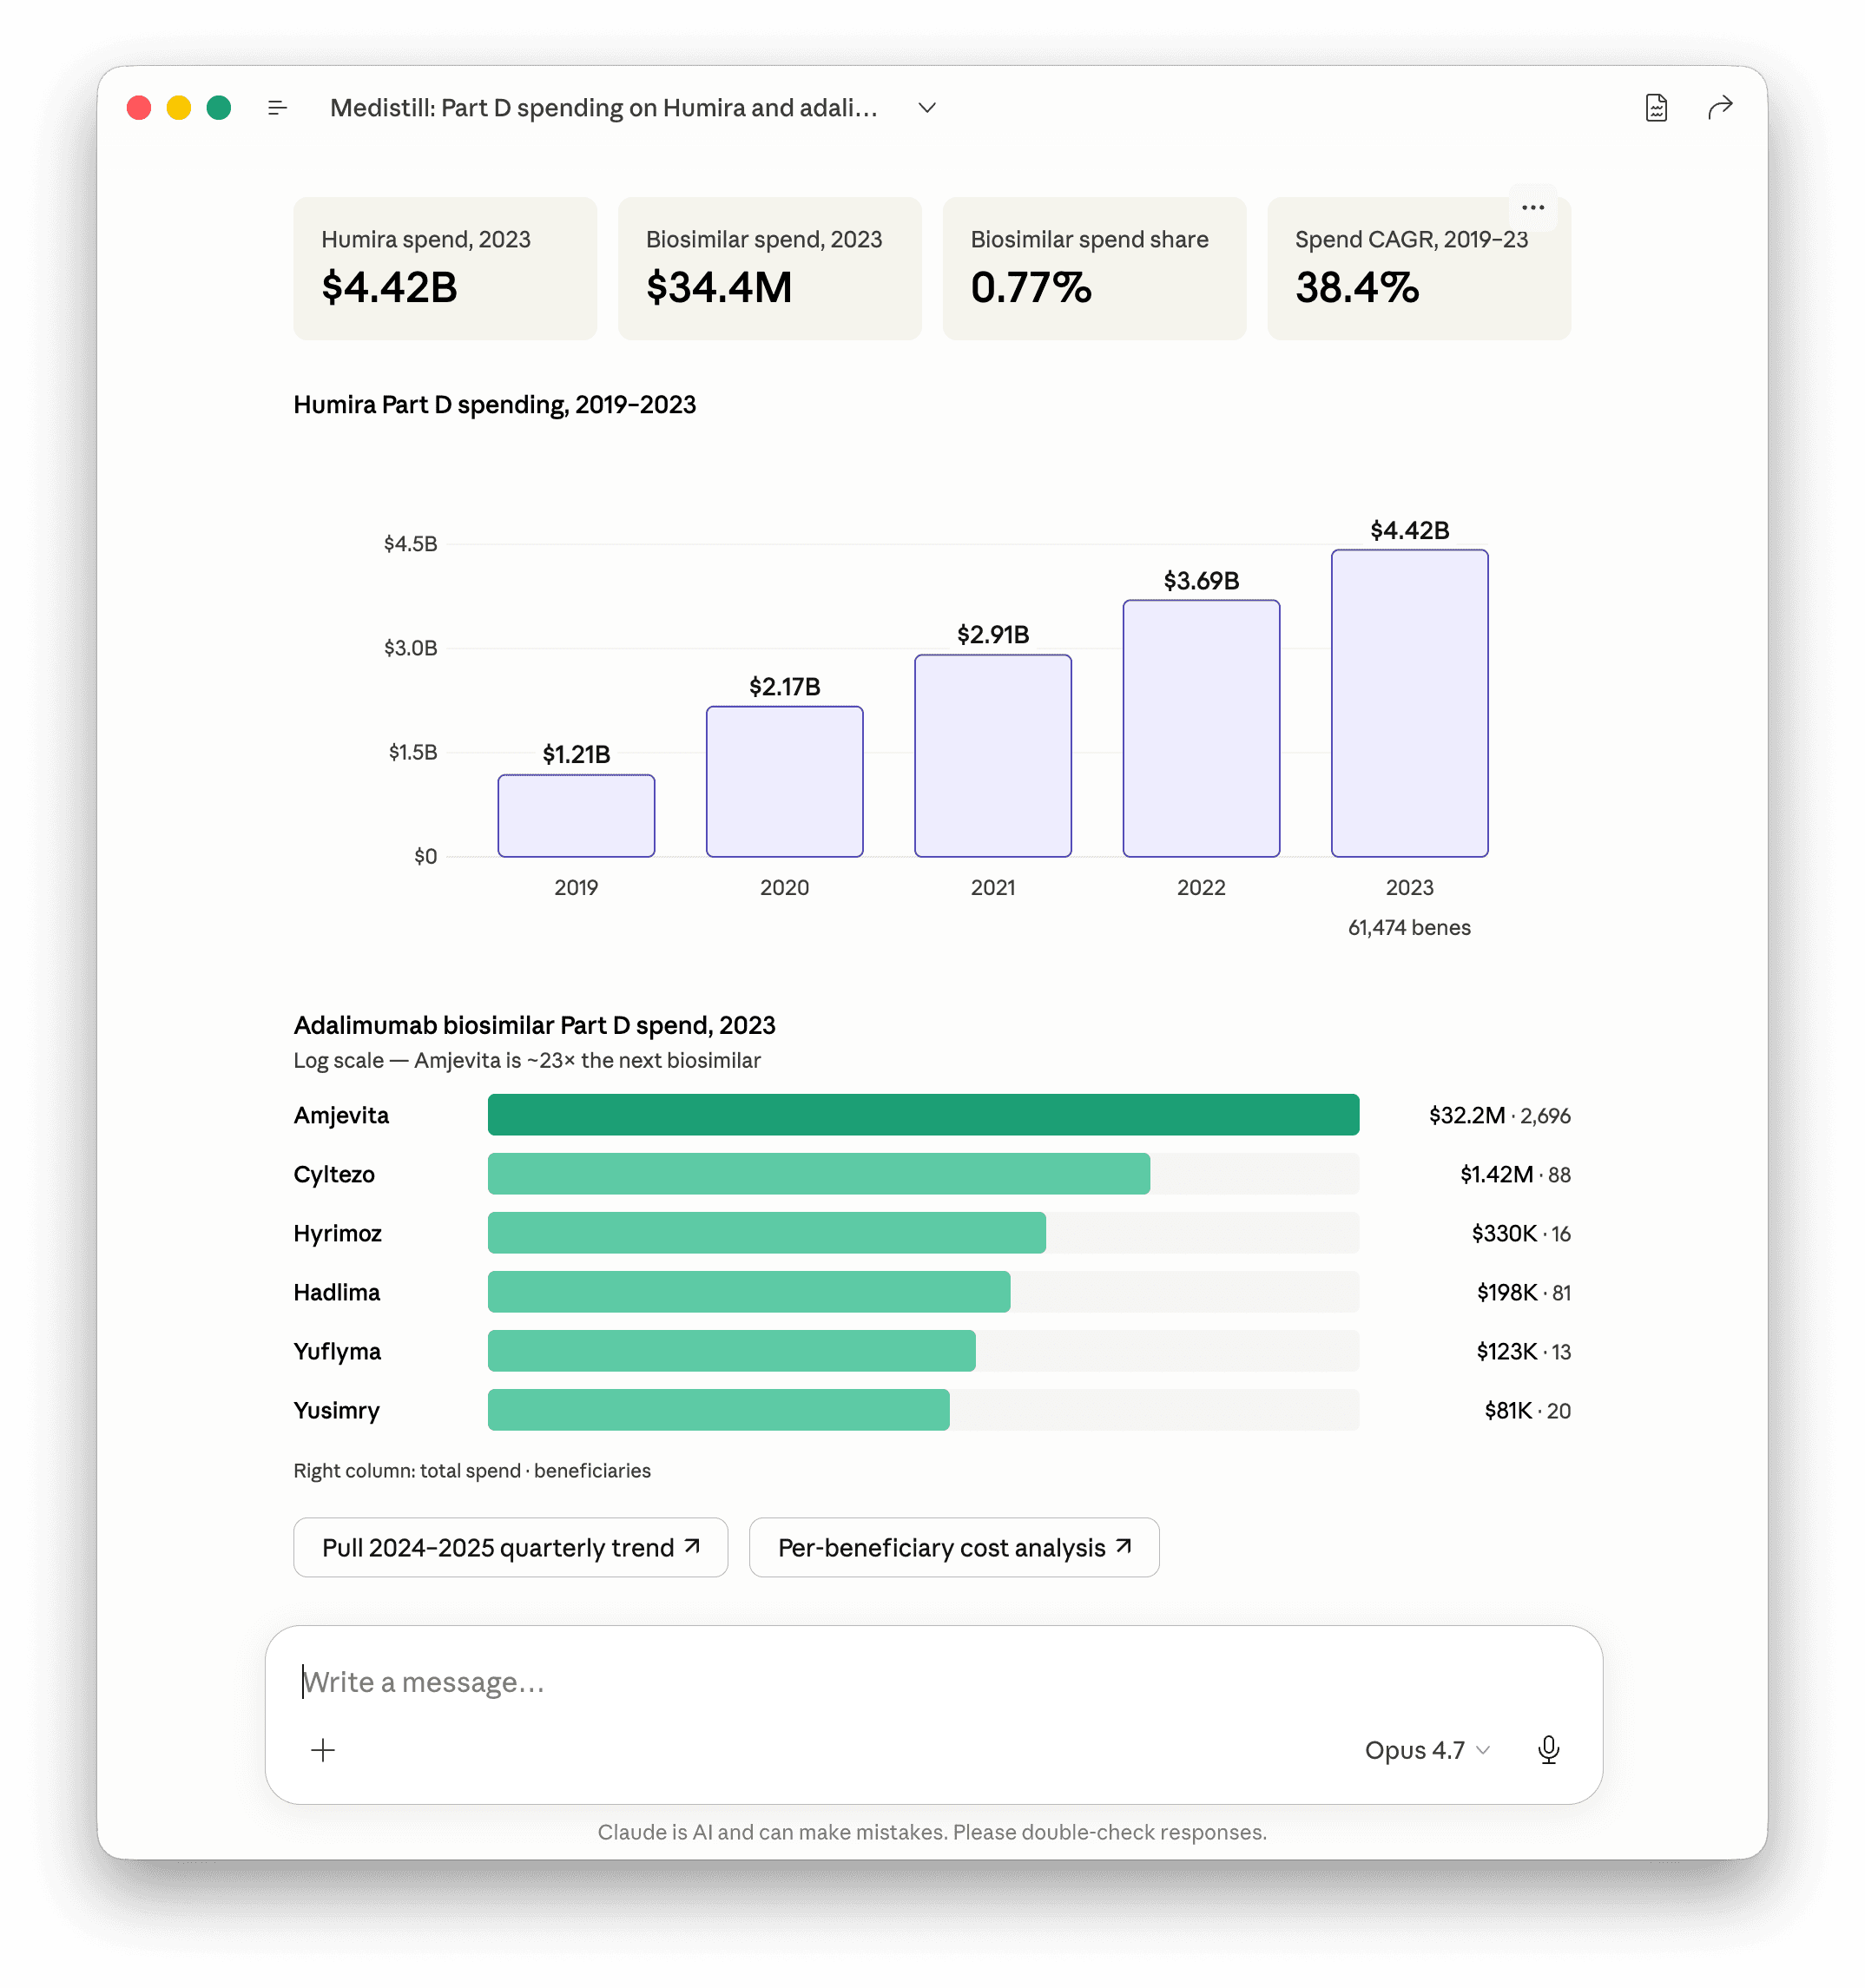
The point of starting here is to fix the baseline. Branded Humira Part D spend was still rising in 2023, the year biosimilars launched. Nothing in the spend trajectory shows competitive pressure. The launch event registered as a non-event in the public payment data.
The pivot question:
Prompt 2:
> Now show me the same metric for 2024 and 2025 year-to-date. Use the CMS quarterly Part D release. Flag any partial years explicitly.
The 2024 release is full year. The 2025 release covers Q1 through Q3. Biosimilar share of adalimumab Part D beneficiaries was 4.5 percent at year-end 2023, 9.1 percent at year-end 2024, and 19.2 percent at September 2025. The biosimilar segment quadrupled in beneficiary share over twenty-one months. Humira itself grew from 61,474 Part D bene in 2023 to 90,349 in 2024 to 87,602 through Q3 2025, so the share gain came from genuine substitution, not from Humira shrinking.
Adalimumab biosimilar share of Part D beneficiaries
Year-end 2023
4.5%
Year-end 2024
9.1%
Q3 2025 YTD
19.2%
Source: CMS Part D Spending by Drug, annual (closed 2019-2023) and quarterly (2024 full year, 2025 Q1-Q3).
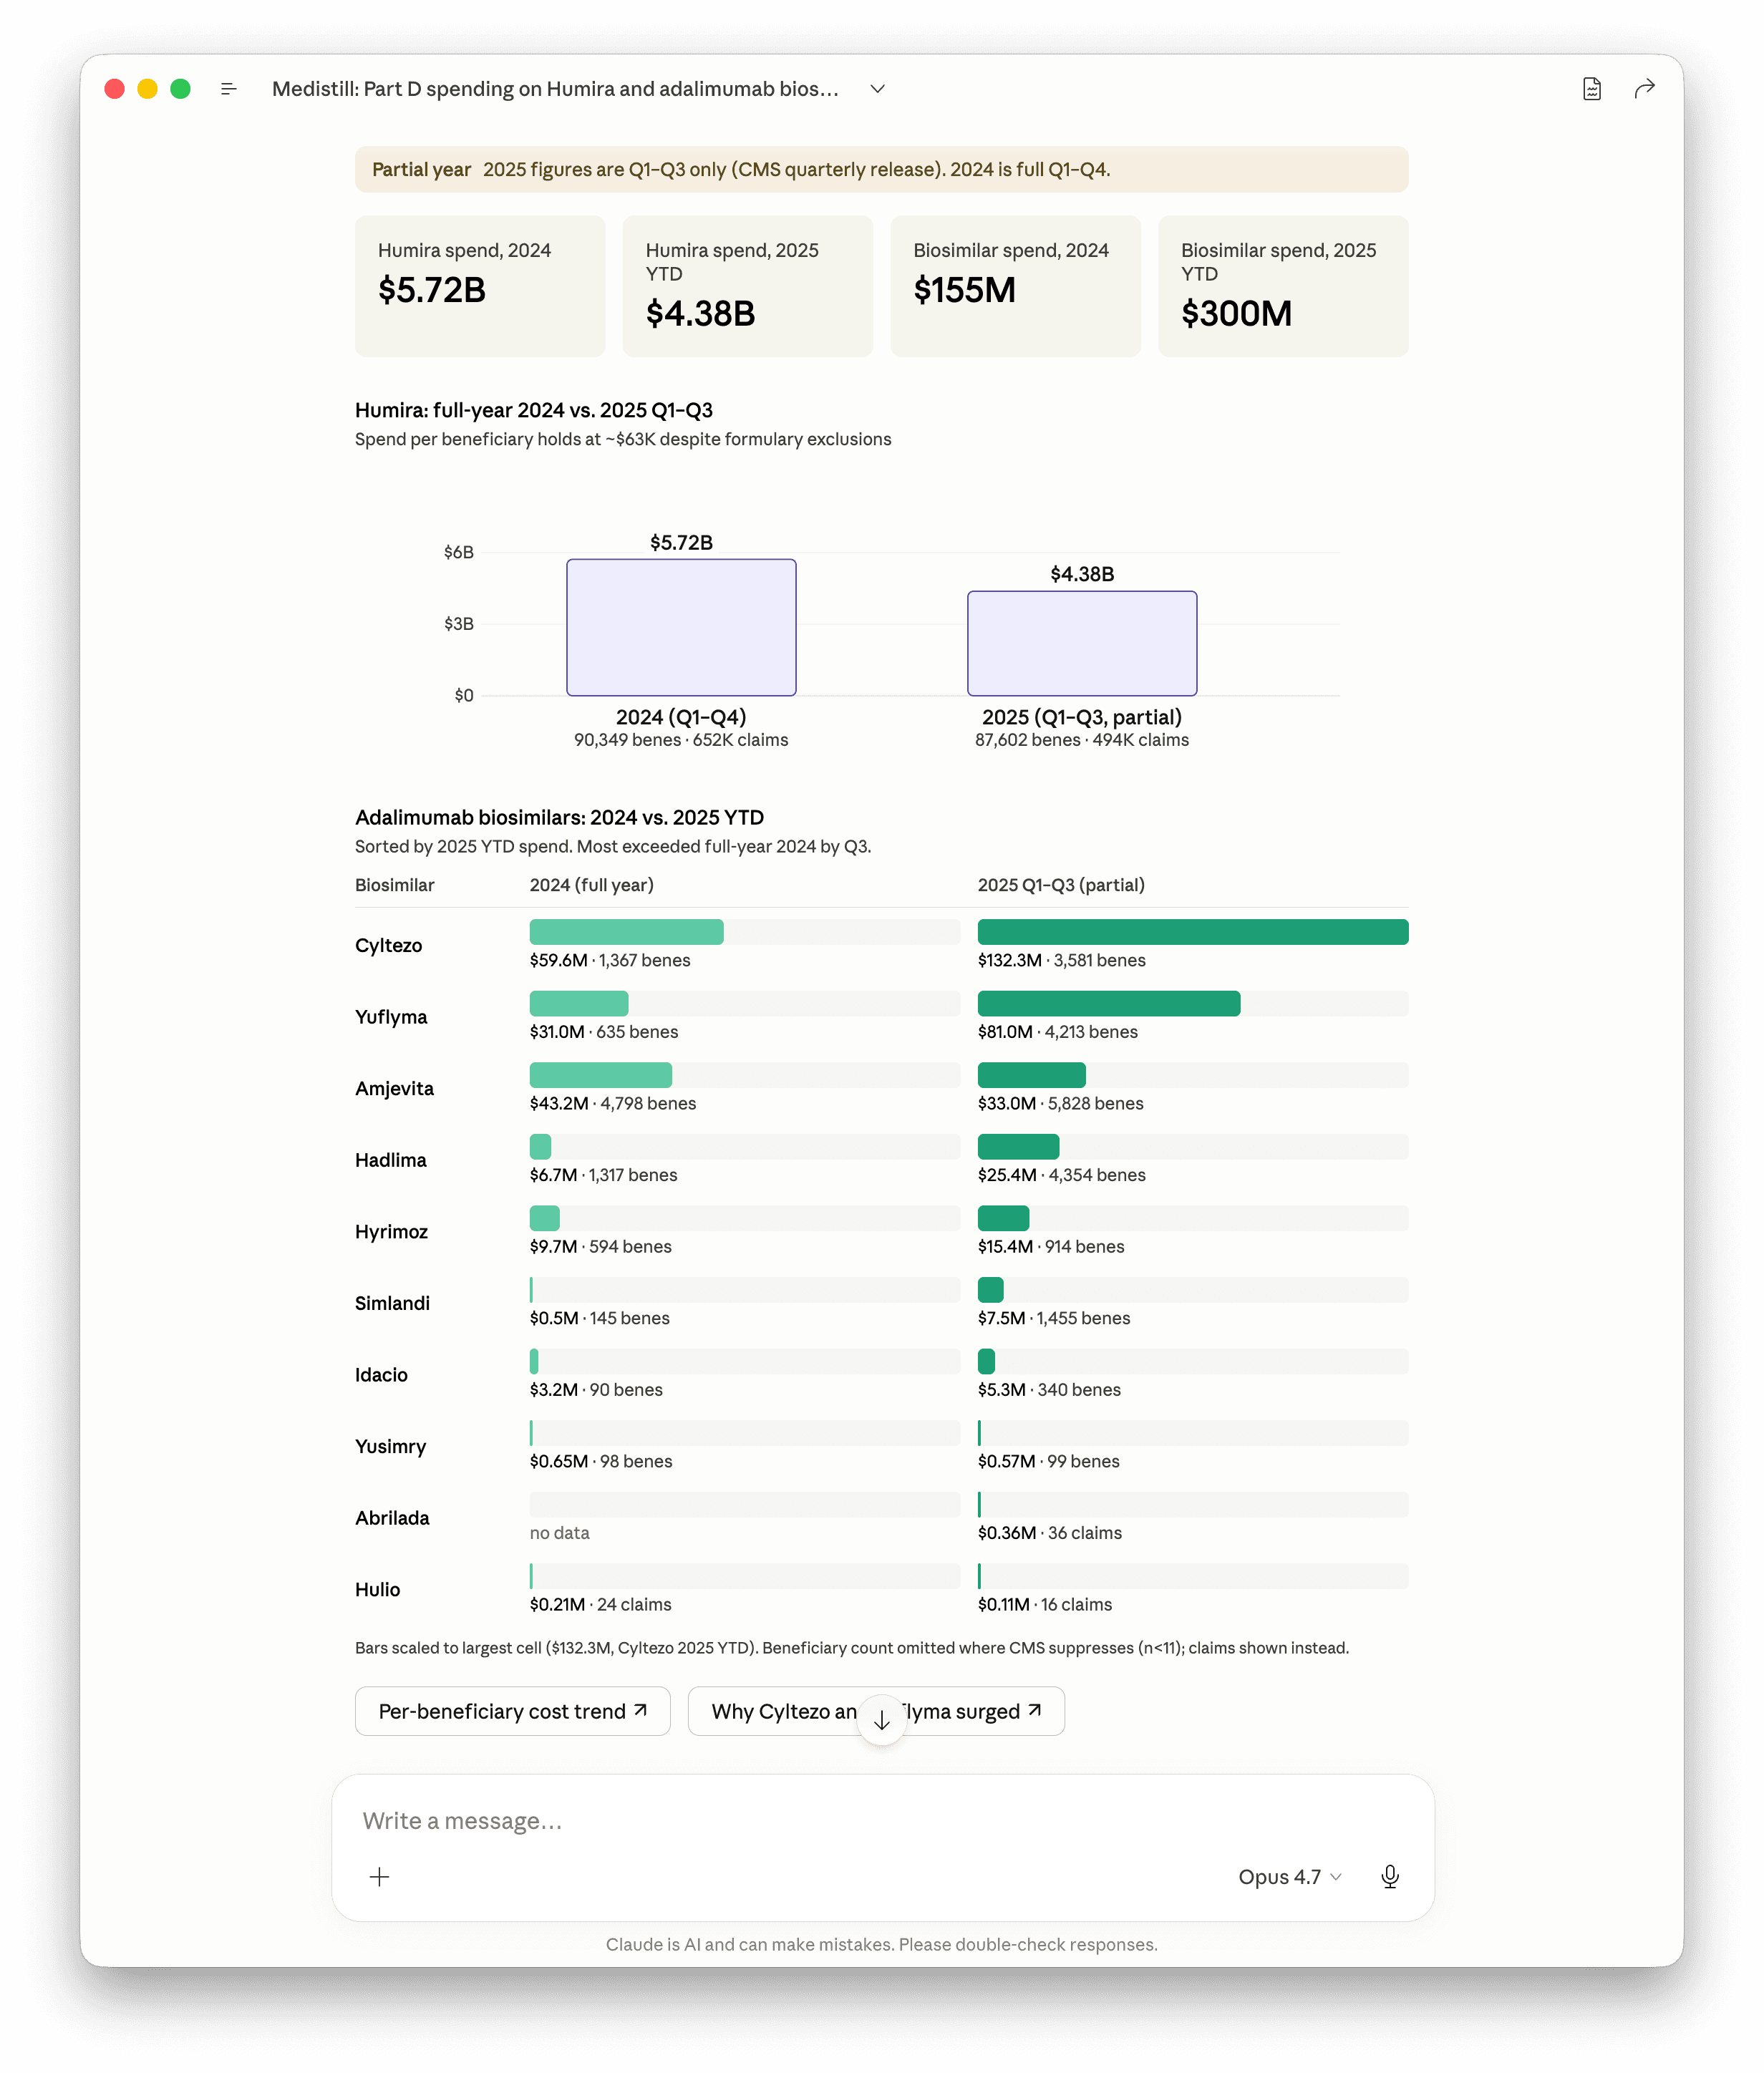
The total segment more than doubled in spend from $155M full-year 2024 to $300M YTD through Q3 2025. Most biosimilars exceeded their full-year 2024 dollar volume by Q3 2025. The reshuffle of which biosimilar dominates is the second story buried in the data, and we'll come back to it.
The flat line
Prompt 3:
> Render a chart showing branded Humira versus adalimumab biosimilar share of Part D adalimumab spending, quarterly from Q3 2023 through Q3 2025. I want the launch line and the slope to be visually obvious.
Worth pausing on what came back from Medistill here. The CMS Part D Spending Dashboard publishes drug-level spend as annual closed years plus cumulative year-to-date snapshots. There are no individual quarter buckets. We have 2019 through 2023 as closed annuals, 2024 as full Q1-Q4, and 2025 as cumulative Q1-Q3. The available data gives you seven periods, not nine quarters. That's a real ceiling on what any research backend (ours or anyone else's) can show off the public file. Claude flagged the limitation directly and rebuilt the chart against what Medistill actually has.
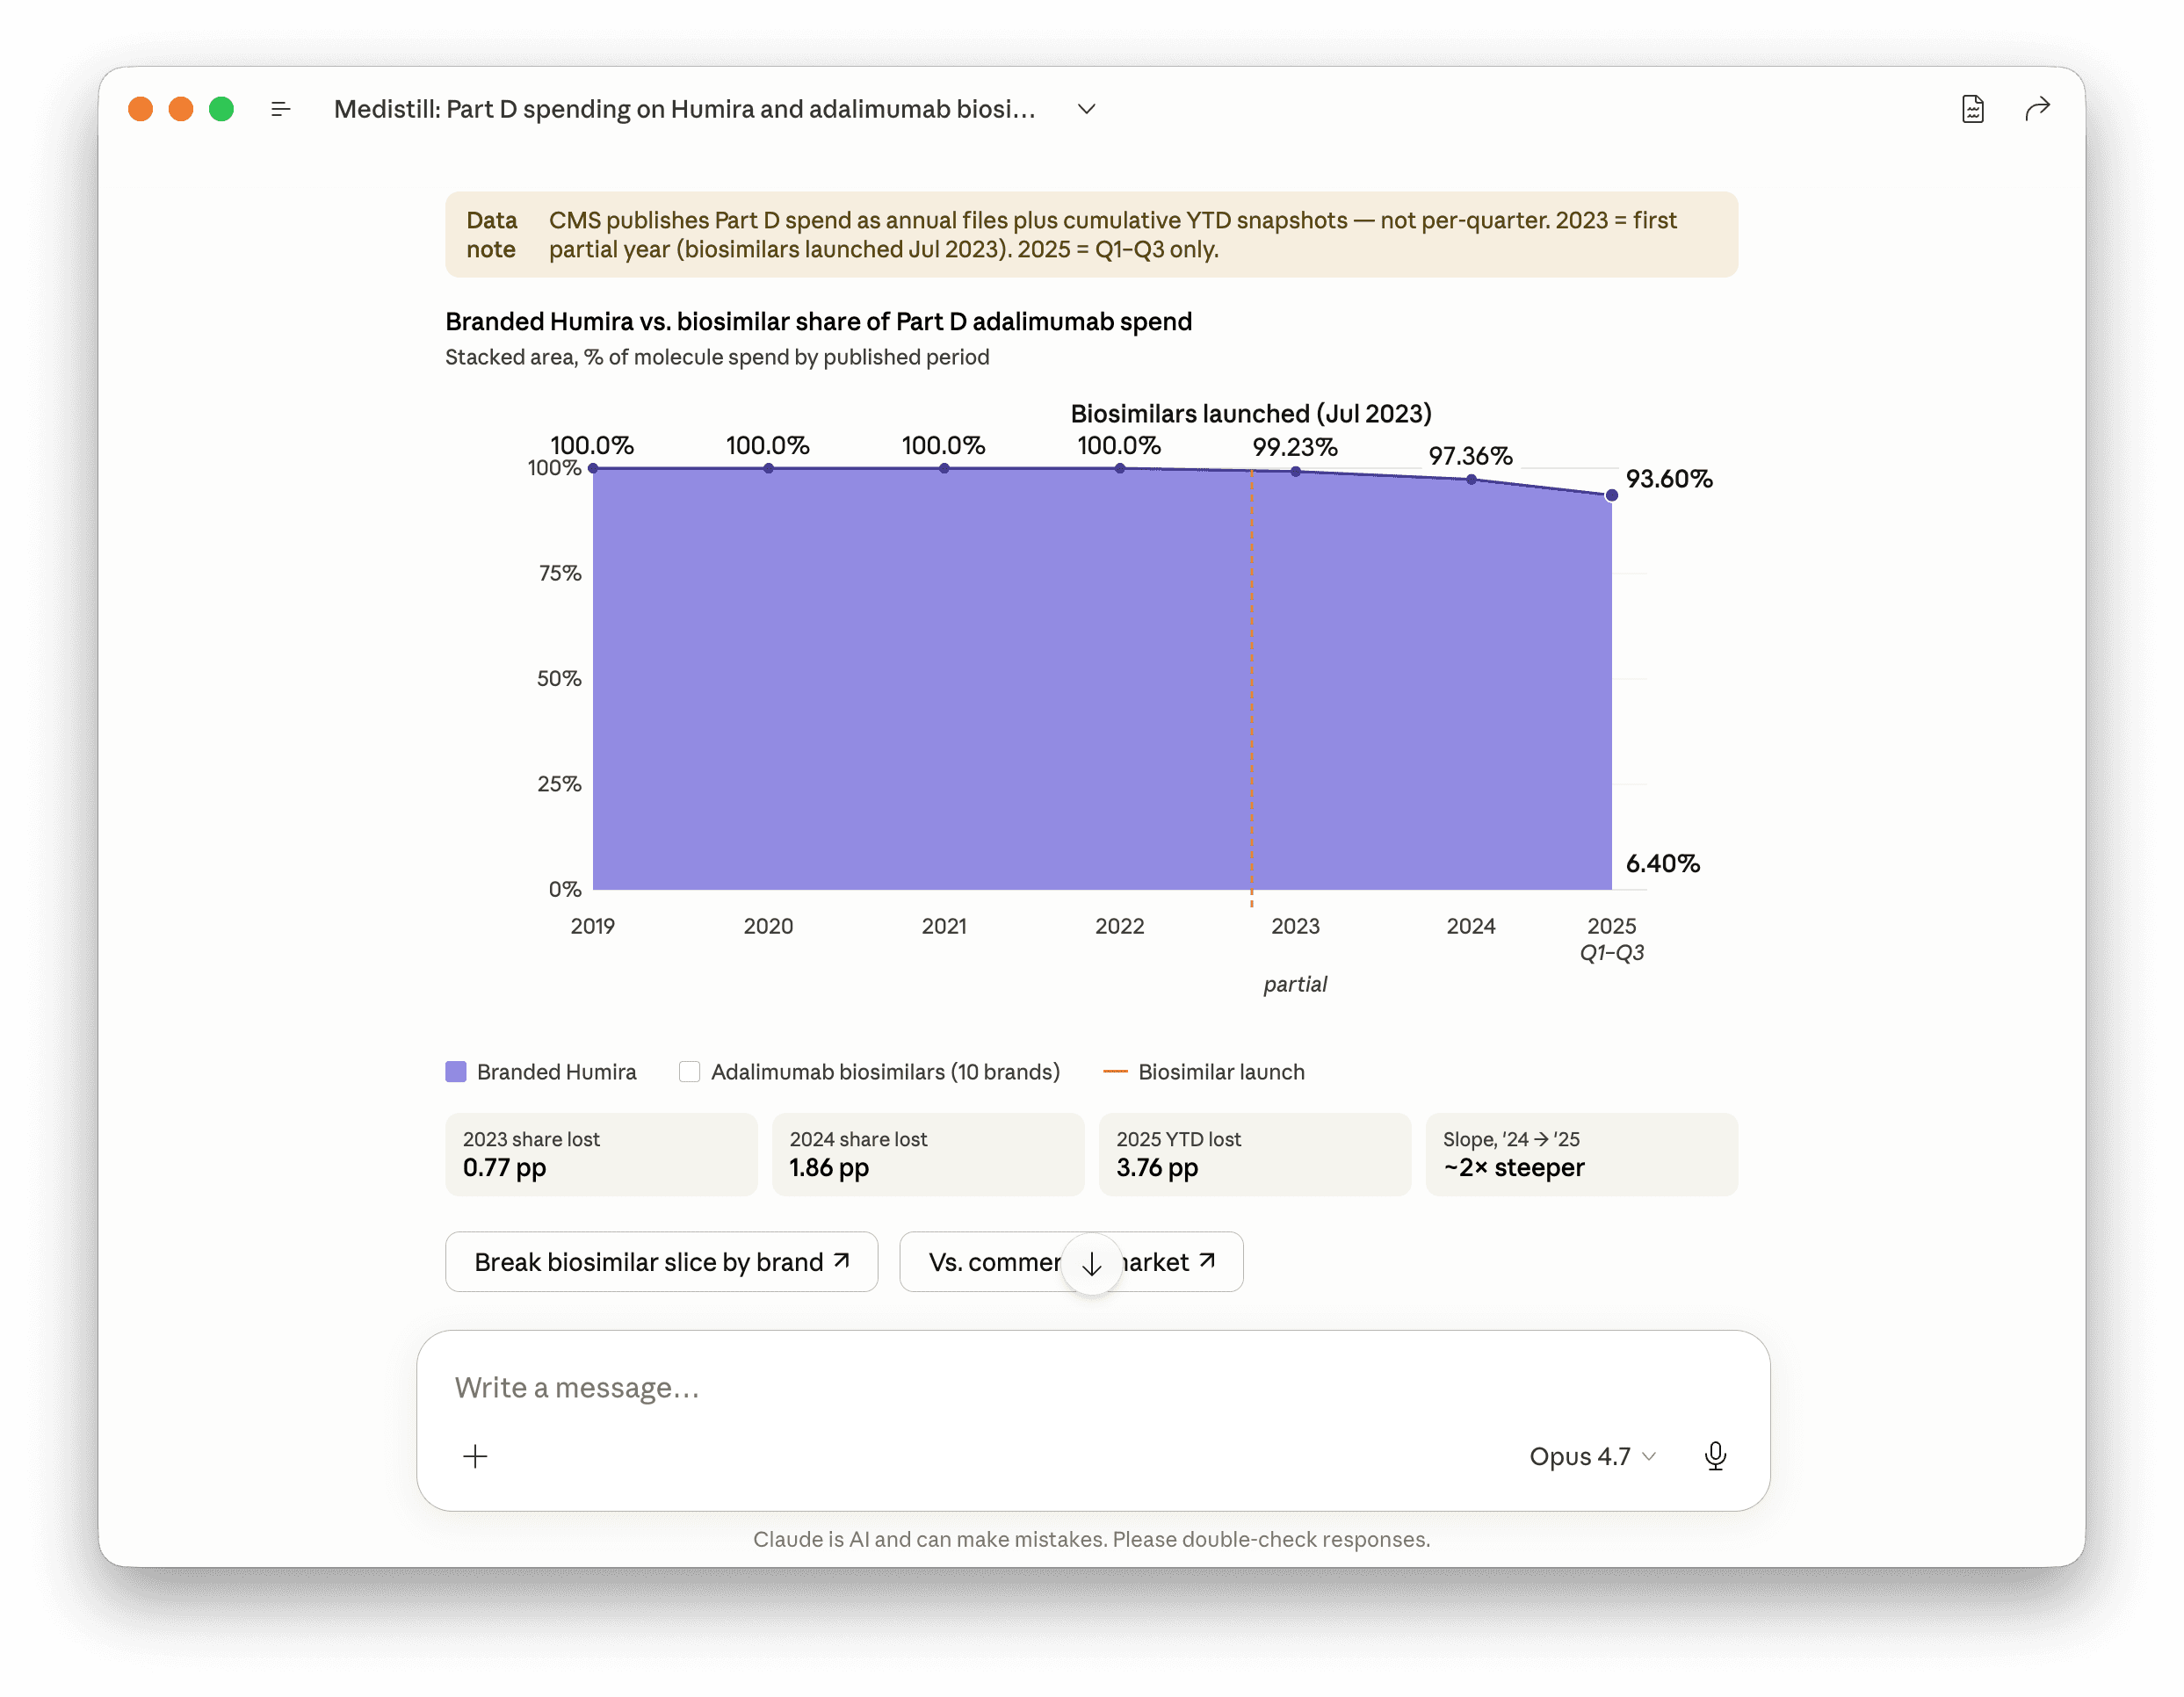
The dollar-share trajectory is 0.77 percent in 2023, 2.64 percent in 2024, and 6.40 percent through Q3 2025. The beneficiary-share trajectory is 4.5 percent, 9.1 percent, and 19.2 percent over the same windows. The two metrics diverge because biosimilars cost a fraction of branded list per patient, so each biosimilar bene moves three to four times less spend than each Humira bene. Beneficiary share is the adoption story. Spend share is the rebate story. Both move; neither tells the full picture alone.
What the chart makes obvious: branded Humira held 100 percent of Part D adalimumab spend for the four years leading into LOE, lost 77 basis points in 2023 (a partial year, biosimilars launched July 2023), 1.86 points in 2024, and 3.76 points in the first nine months of 2025. The slope from year-end 2024 to Q3 2025 is roughly twice as steep as from 2023 to 2024. We can't observe what happened inside Q1 2024 specifically because the data doesn't support that resolution, but the 2023-to-2024 delta of 1.86 points across twelve months implies the early 2024 quarters were tracking close to the 2023 pace, and the inflection lands somewhere in 2024 between the CVS April pivot and the post-FTC summer.
The reason for the flat line sits on the formulary side. Through Q1 2024, CVS Caremark, Express Scripts, and OptumRx all kept Humira at preferred or non-preferred branded tier across the bulk of their Part D and commercial books. The biosimilars existed. Pharmacies could acquire them. The FDA had approved them. None of that mattered. If a plan's PBM did not process the biosimilar at preferred-tier copay, the prescriber wrote branded Humira because that's what their patient could afford.
This is what Cost Plus has been pointing at for two years. The formulary placement is the gate. Price negotiation is downstream of placement. AbbVie's response to LOE was not to drop list price. List price actually rose in 2023. The rebate stack rose to match. PBM disclosed compensation on Schedule C rose in parallel. Net cost to plan sponsors rose despite the existence of FDA-approved competition priced at a fraction of branded list.
AbbVie kept the rebate stack. The PBMs kept the formulary.
The pivot
Prompt 4:
> What public events in calendar year 2024 are most credibly associated with the PBM industry's pivot on adalimumab biosimilar formulary placement? Cross-reference Optum announcements, FTC enforcement actions, and House Oversight Committee testimony.
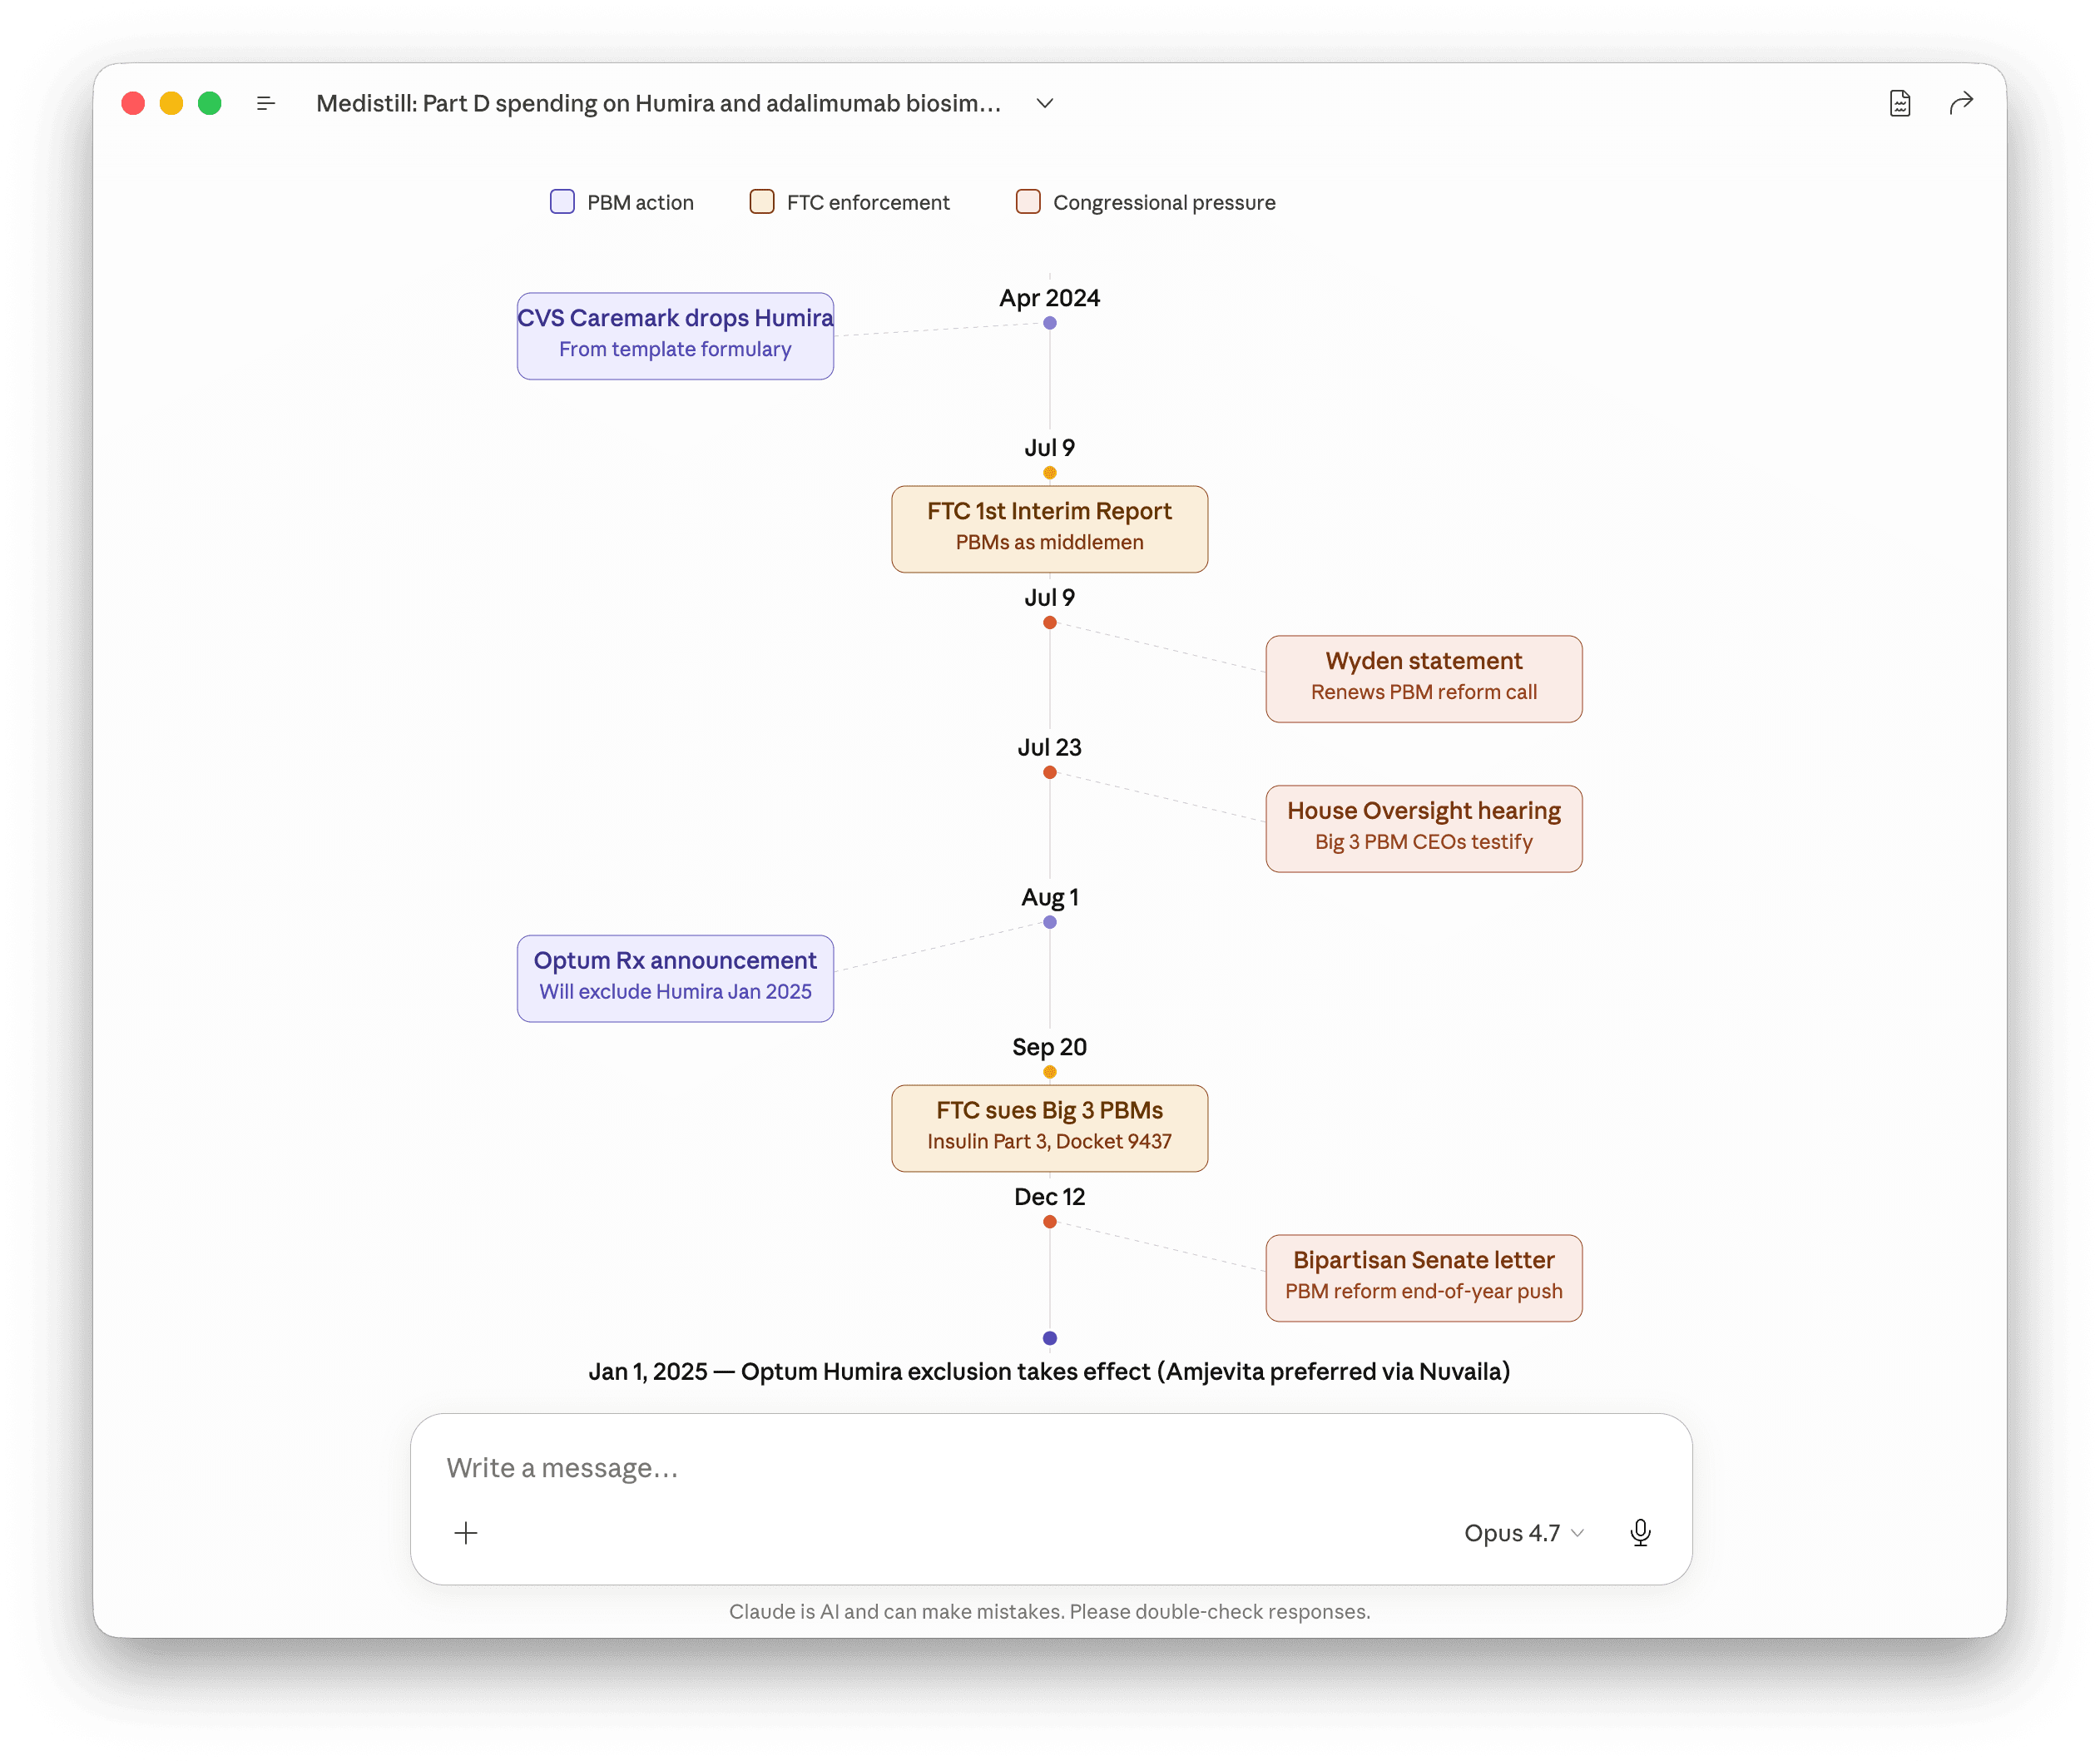
Six pivot points, in chronological order. The first one is commercial logic. The next five are regulatory and reputational pressure stacking up. Each is detailed below.
April 1, 2024
CVS Caremark breaks first (commercial)
CVS Caremark removes Humira from its major commercial template formularies, replacing it with Cordavis-branded Hyrimoz. Cordavis is a CVS Health subsidiary launched in August 2023 specifically to co-market the Sandoz biosimilar. The driver was commercial: AbbVie refused to deepen rebates further once Cordavis went live, so the math on holding Humira at preferred tier flipped. This was not a response to regulatory pressure. It was an internal margin calculation, and it was the only one of the five events on this list that wasn't.
July 9, 2024
FTC interim staff report
FTC publishes Pharmacy Benefit Managers: The Powerful Middlemen Inflating Drug Costs and Squeezing Main Street Pharmacies. Names Caremark, Express Scripts, and OptumRx as the dominant managers of more than $300B in annual branded drug spend, with Humira biosimilar formulary suppression cited explicitly. Senator Wyden of Senate Finance issues a same-day statement endorsing the findings.
July 23, 2024
House Oversight hearing
Big 3 PBM CEOs testify under oath at House Oversight: David Joyner (Caremark), Adam Kautzner (Express Scripts), Patrick Conway (OptumRx). Direct questioning on adalimumab formulary placement and rebate retention. Note: there was no equivalent 2024 Senate Finance hearing. The Senate activity was statements and letters, not testimony elicited.
August 1, 2024
OptumRx announces Humira exclusion
OptumRx announces it will exclude branded Humira from its commercial formularies effective January 2025, in favor of biosimilars including Amjevita through Nuvaila, OptumRx's own private-label biosimilar partnership. Three weeks after the FTC report. One week after the House Oversight hearing.
September 20, 2024
FTC Part 3 administrative complaint
FTC files an administrative complaint against Caremark and its rebate aggregator Zinc Health Services, Express Scripts and Ascent Health Services, and OptumRx and Emisar Pharma Services. The complaint alleges the Big 3 systematically preferred high-list, high-rebate insulin brands over lower-priced alternatives. The case is about insulin, but the mechanism alleged is identical to the adalimumab dynamic, and the complaint exists in the public record as evidence of how the FTC believes the rebate stack distorts formulary placement.
December 12, 2024
Bipartisan Senate letter
End-of-year bipartisan Senate letter on PBM reform keeps the political pressure live through the lame-duck window and into the new Congress. Reform legislation does not pass in 2024 but the threat environment carries forward.
By Q1 2025, independent PBMs (Navitus, Capital Rx, MaxorPlus, SmithRx, others operating on a transparent pass-through model) are reporting adalimumab biosimilar share above 70 percent in their books. The book-level discrepancy is itself a data point. Same drug, same FDA approval, same launch date. Different rebate model. Order-of-magnitude different uptake.
The eighteen-month flat line broke the moment regulatory and reputational pressure made retaining it more expensive than abandoning it. Not when biosimilars launched. Not when generics-style economics suggested they should. When the rebate calculus tipped.
What makes the post-pivot data interesting is which biosimilars actually won, and what that says about the rebate model itself. Each of the Big 3 cut its own private-label biosimilar deal: CVS Caremark with Cordavis (Hyrimoz), OptumRx with Nuvaila (Amjevita), Express Scripts with Quallent (Hadlima and others). The PBMs replaced branded Humira's rebate stack with margin captured inside their own subsidiary structures. Through Q3 2025, however, none of the three private-label picks dominate the segment. The Part D leaders are Cyltezo at $132M (Boehringer Ingelheim, granted FDA interchangeable status October 2023, which allows pharmacy-level substitution without prescriber approval) and Yuflyma at $81M (Celltrion). Hyrimoz is fifth at $15M. Amjevita actually contracted in dollar terms even as its bene count grew. The reading: when each PBM points its own book at its own private-label product, the open Medicare market goes to the biosimilar with interchangeable status and pharmacy-substitutable economics, not to whichever PBM placed the bet earliest. The rebate machine got restructured, not retired.
The price gap
Prompt 5:
> Pull NADAC unit cost for every Humira NDC and every adalimumab biosimilar NDC. NADAC is the National Average Drug Acquisition Cost that CMS publishes weekly. Per-pen acquisition cost, sorted.
NADAC is the closest public proxy for what a pharmacy actually pays at the wholesale acquisition layer. It's compiled from monthly surveys of retail community pharmacies and updated weekly. As of the December 17, 2025 snapshot, NADAC carries 21 active adalimumab NDCs. Branded Humira sits between $3,366 and $6,745 per pen. Biosimilar NDCs run from $487 (Simlandi 40mg autoinjector) to roughly $3,200 (Cyltezo branded). At the same 40mg pen form, the Humira premium over the cheapest biosimilar is roughly 7x. Across all forms, peak Humira to cheapest biosimilar is 13.9x.
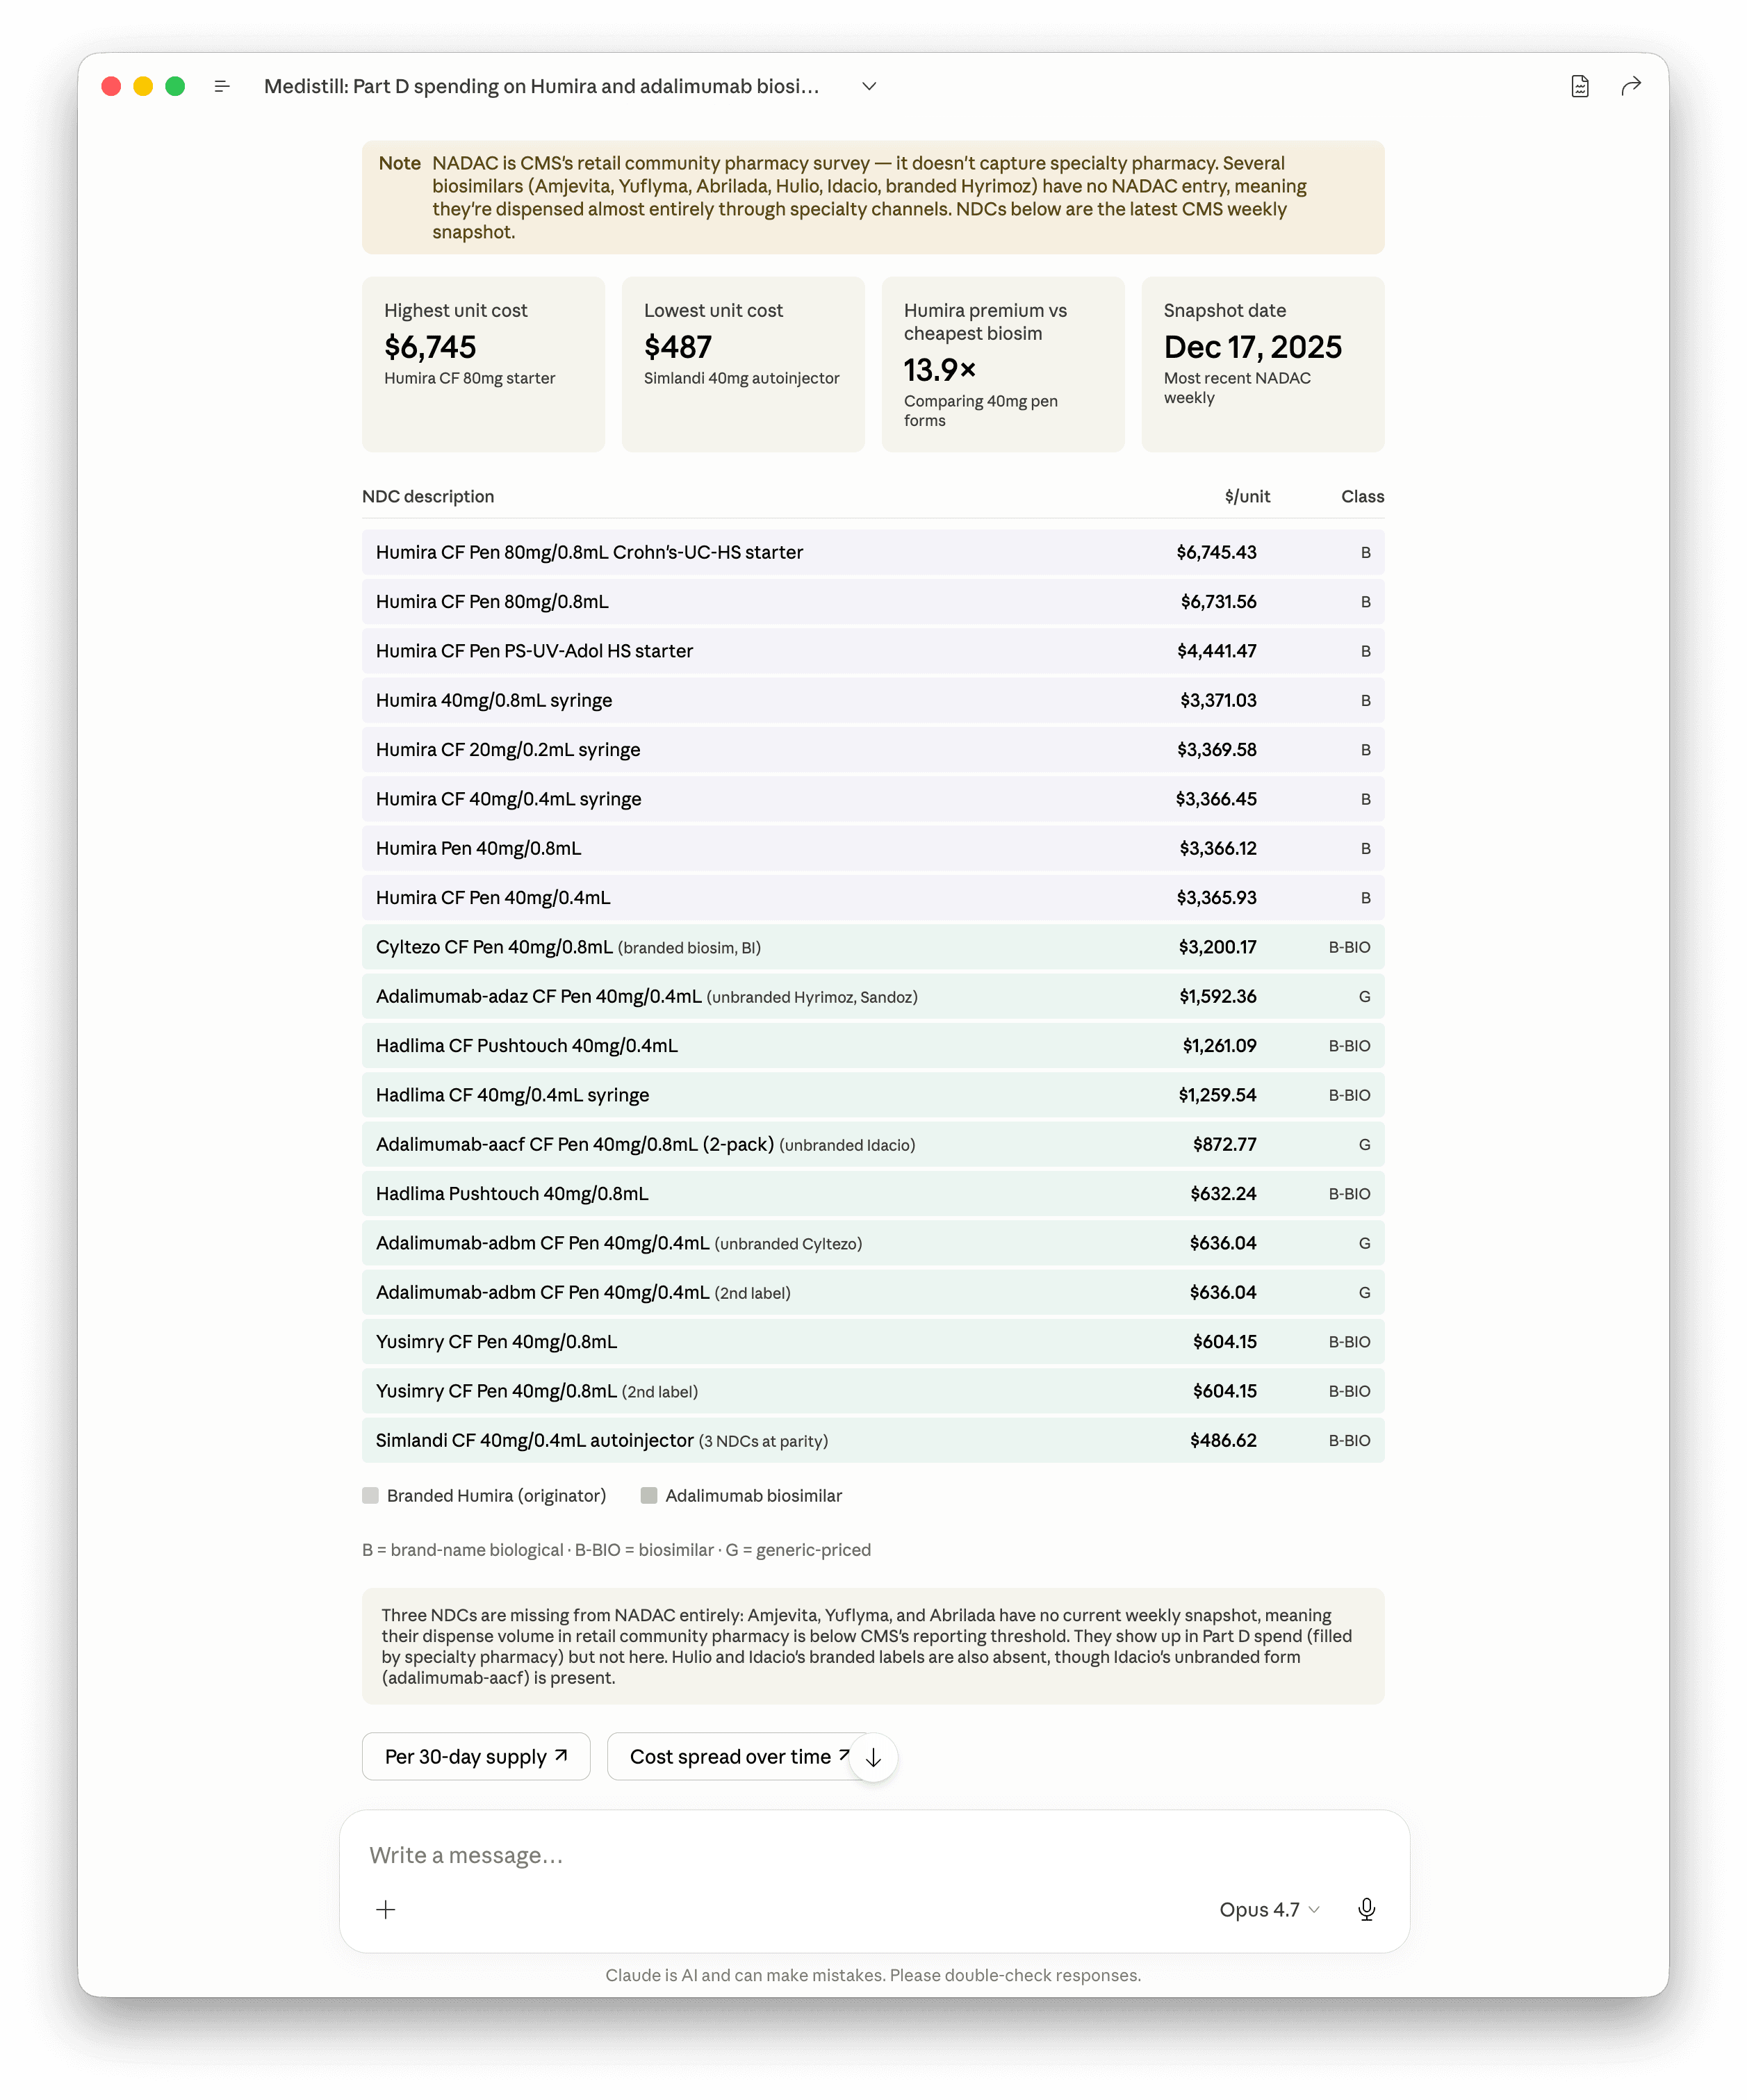
Two things in the table merit a paragraph each, because they are the two cleanest visualizations of the rebate machine anywhere on the regulatory record.
The branded versus unbranded split.Cyltezo branded clears NADAC at $3,200. The pharmacologically identical unbranded form, adalimumab-adbm, clears at $636. Same molecule, same manufacturer (Boehringer Ingelheim), same site of manufacture, different label, and a 5x price gap. The unbranded versions of Hyrimoz (adalimumab-adaz) and Idacio (adalimumab-aacf) show the same pattern. This is the plumbing of the PBM-rebate-aggregator economics that the FTC's September 20 complaint targets. The branded biosimilar enters the formulary, the rebate aggregator captures spread on the branded list price, the unbranded pharmaceutically-identical version sits at one-fifth the cost on the same shelf for cash-pay patients. Same molecule, two pricing universes, separated by a label.
NADAC has a coverage gap, and the gap is the story. Three biosimilars with meaningful Part D spend (Amjevita, Yuflyma, Abrilada) have no NADAC entry at all. They're being dispensed; they just don't move through retail community pharmacies in volume large enough to clear CMS's reporting threshold. They move through PBM-owned specialty pharmacy operations: CVS Specialty, Accredo (Express Scripts), OptumRx Specialty. The price the pharmacy pays in those channels is private. The data gap in the public file is itself the rebate story. When the formulary moves, the dispensing channel moves with it, and the pricing transparency that retail NADAC offers does not follow.
This is the price reality Cuban has been articulating. Cost Plus prices its adalimumab biosimilar in the unbranded-NADAC neighborhood, plus a transparent dispensing fee, and is open about every dollar in the markup. There is no rebate. There is no spread. There is no formulary gate. There is one molecule, one acquisition cost, one published price.
A Part D plan paying $4.4B for branded Humira in 2023 isn't paying NADAC. It's paying NADAC plus PBM margin plus rebate calculus plus average wholesale price spread, and then receiving rebates back that the plan sometimes sees and sometimes doesn't. The retained spread is the product. The biosimilar at NADAC pricing bypasses that product, which is precisely why the biosimilar took eighteen months to make formulary at the Big 3.
The molecule is the same. The pricing universe is the variable.
A worked example sits in the FTC's January 2025 second interim staff report on PBMs. Abiraterone, the generic prostate-cancer drug. The report calls out a commercial-plan monthly cost on this molecule, side by side with what Cost Plus charges. Both numbers are on the FTC's site. Both are reproducible from our sources in seconds.
Prompt 5.5:
> What did the FTC PBM 6(b) report find on abiraterone commercial-plan pricing? Pull that, then compare to Cost Plus on the same drug at standard 30-day dosing (4 tablets/day, 120 tabs). What's the multiple?
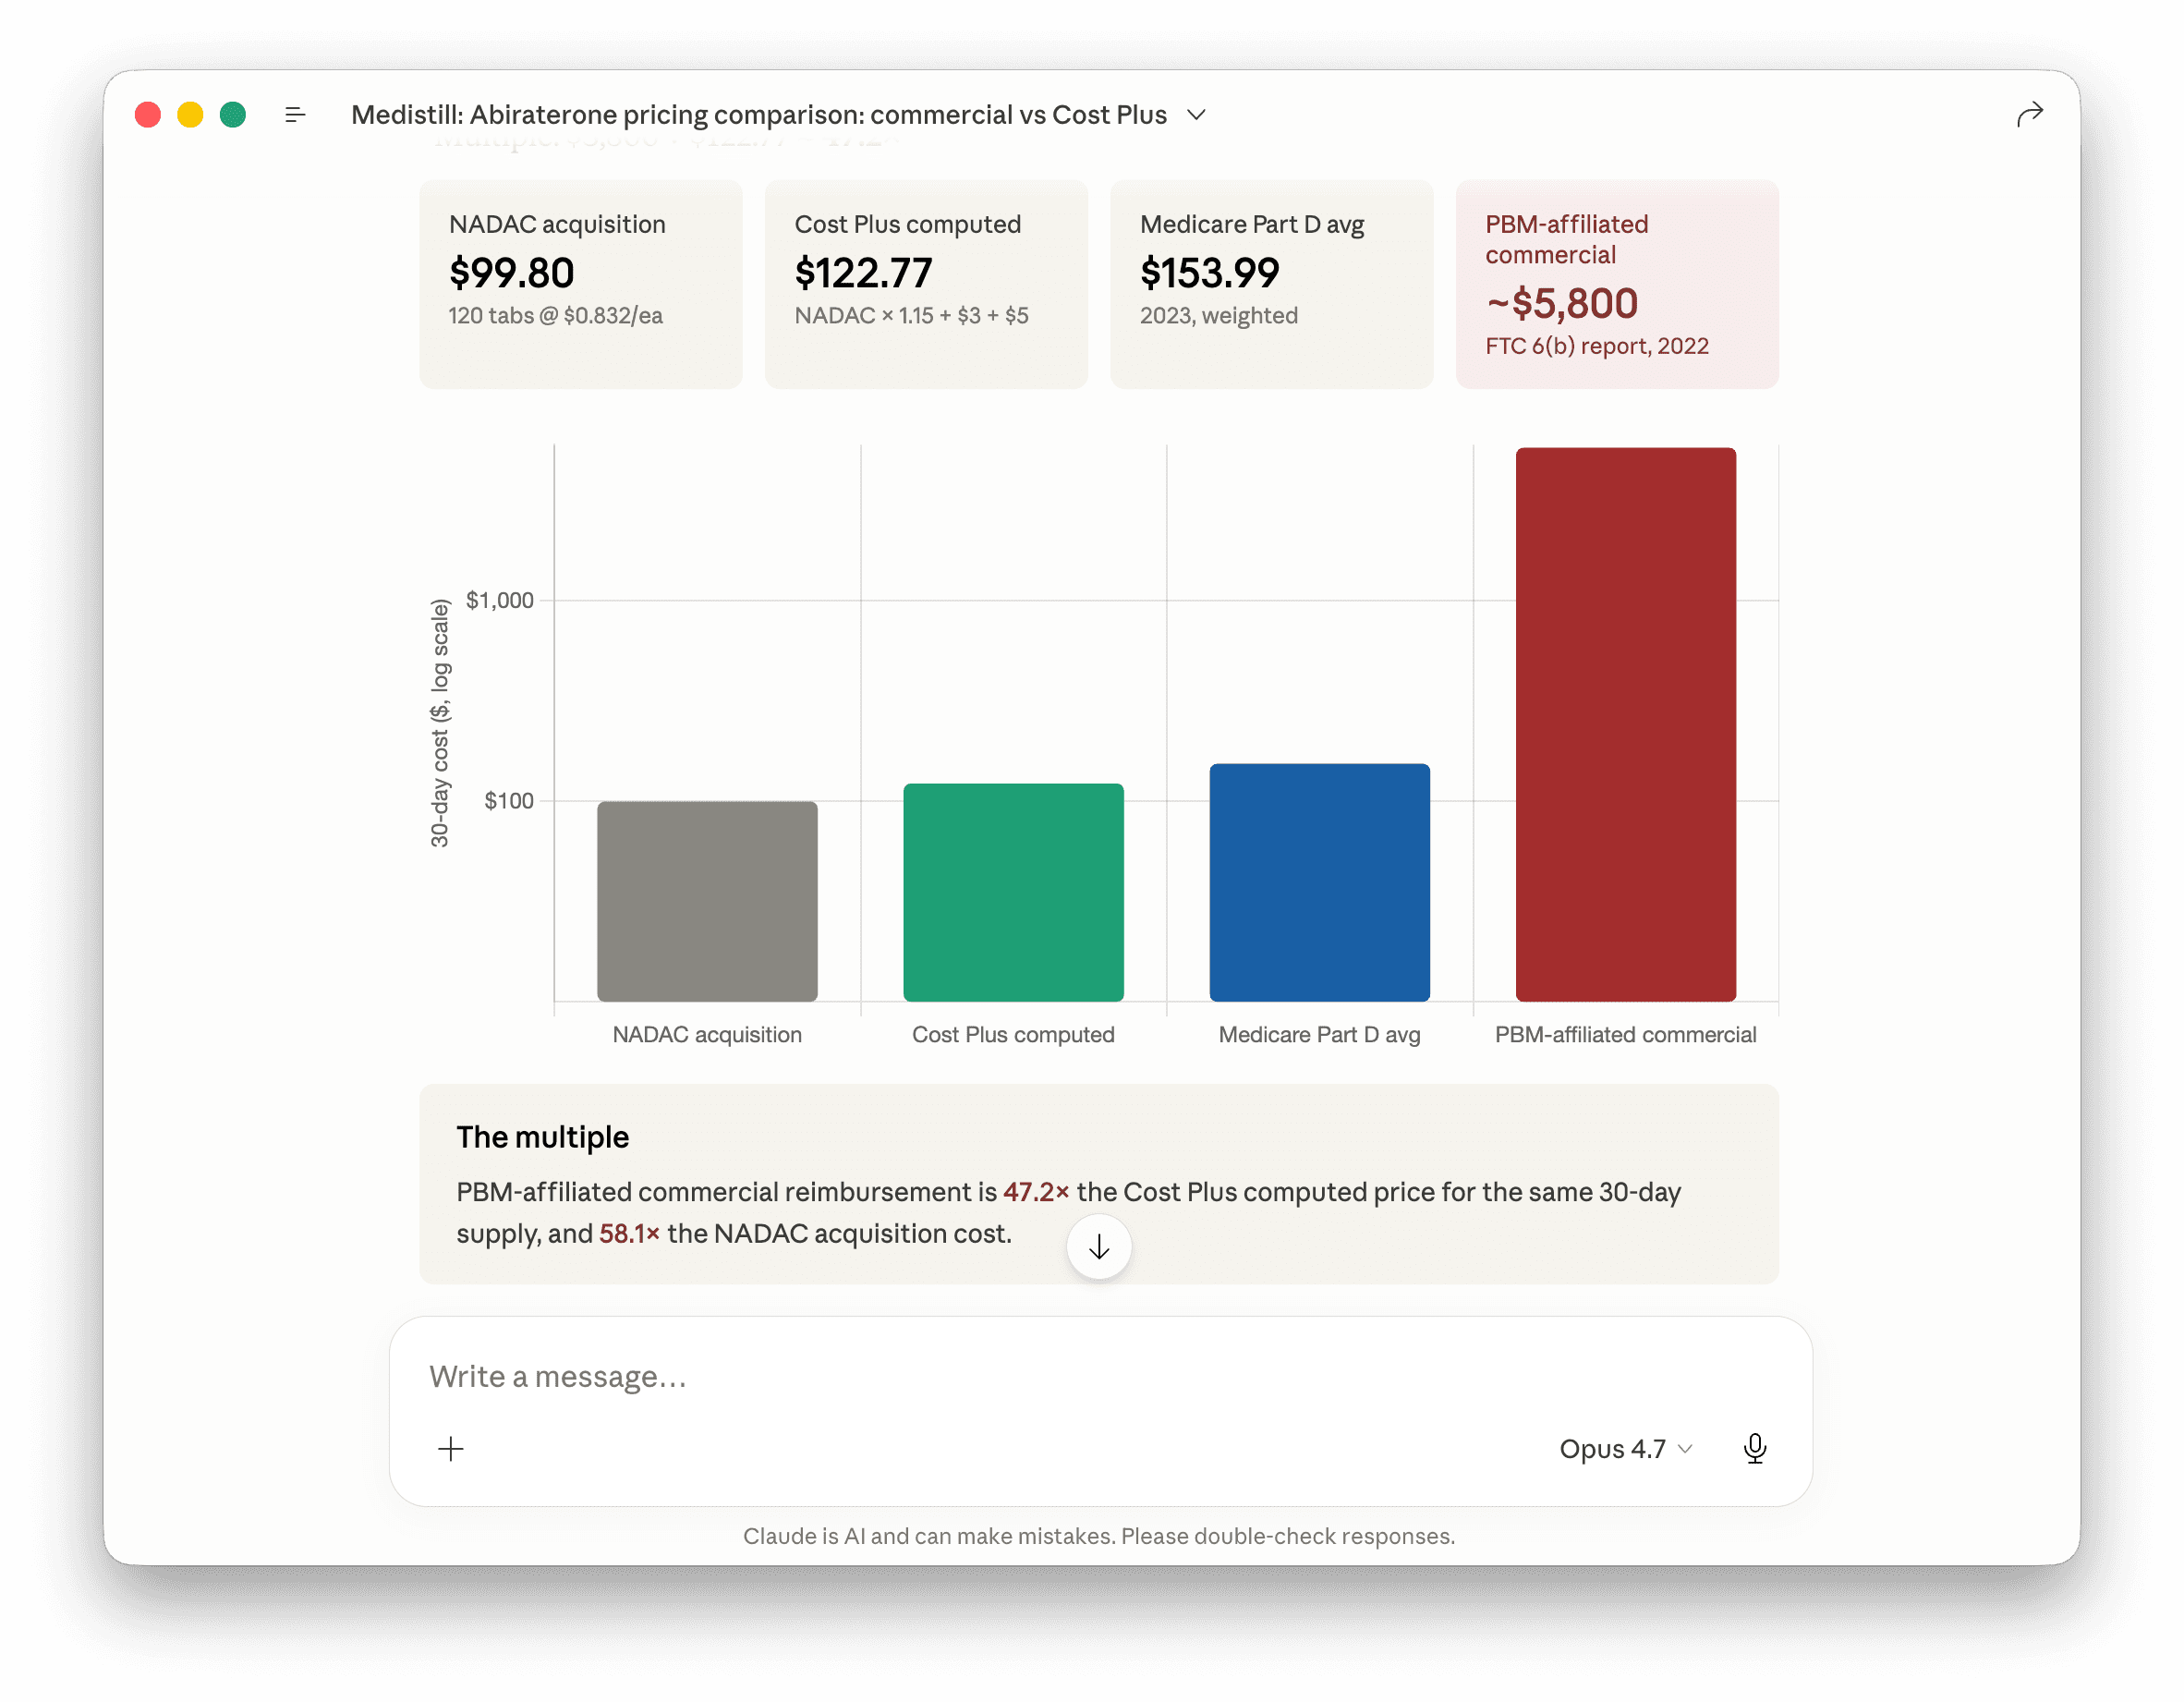
The multiple lands in the high-40s at current NADAC. On one drug. The FTC report scored seventy molecules using the same methodology. The pattern repeats every time the receipts get pulled.
Note: the published Cost Plus per-tablet figure sometimes gets quoted at per-pack rather than per-monthly-course pricing, which inflates apparent multiples to triple digits. The number above is at the actual dose a prostate-cancer patient takes for thirty days.
What Schedule C says about the magnitude
Prompt 6:
> Pull Form 5500 Schedule C disclosed compensation for the three largest PBMs (OptumRx, Express Scripts, CVS Caremark) for plan year 2023. Total dollars and number of filings.
Schedule C is the ERISA disclosure for direct and indirect compensation paid to plan service providers. It's a floor, not a ceiling. Retained manufacturer rebates that the PBM does not pass through are not on Schedule C. Compensation routed through ASO health-carrier filings on Schedule A is not on Schedule C. Spread retained on retail, mail, or specialty pharmacy is not on Schedule C.
The 2023 Schedule C floor for the Big 3 across 944 plan-line entries (924 unique filings) is $2.11B in disclosed compensation. OptumRx disclosed $1.49B across 386 filings. Express Scripts $313M across 360 filings. CVS Caremark $311M across 178 filings. Of that $2.11B total, only 0.24 percent is reported as indirect compensation. That is not because indirect compensation is rare. It is because of an ERISA carve-out.
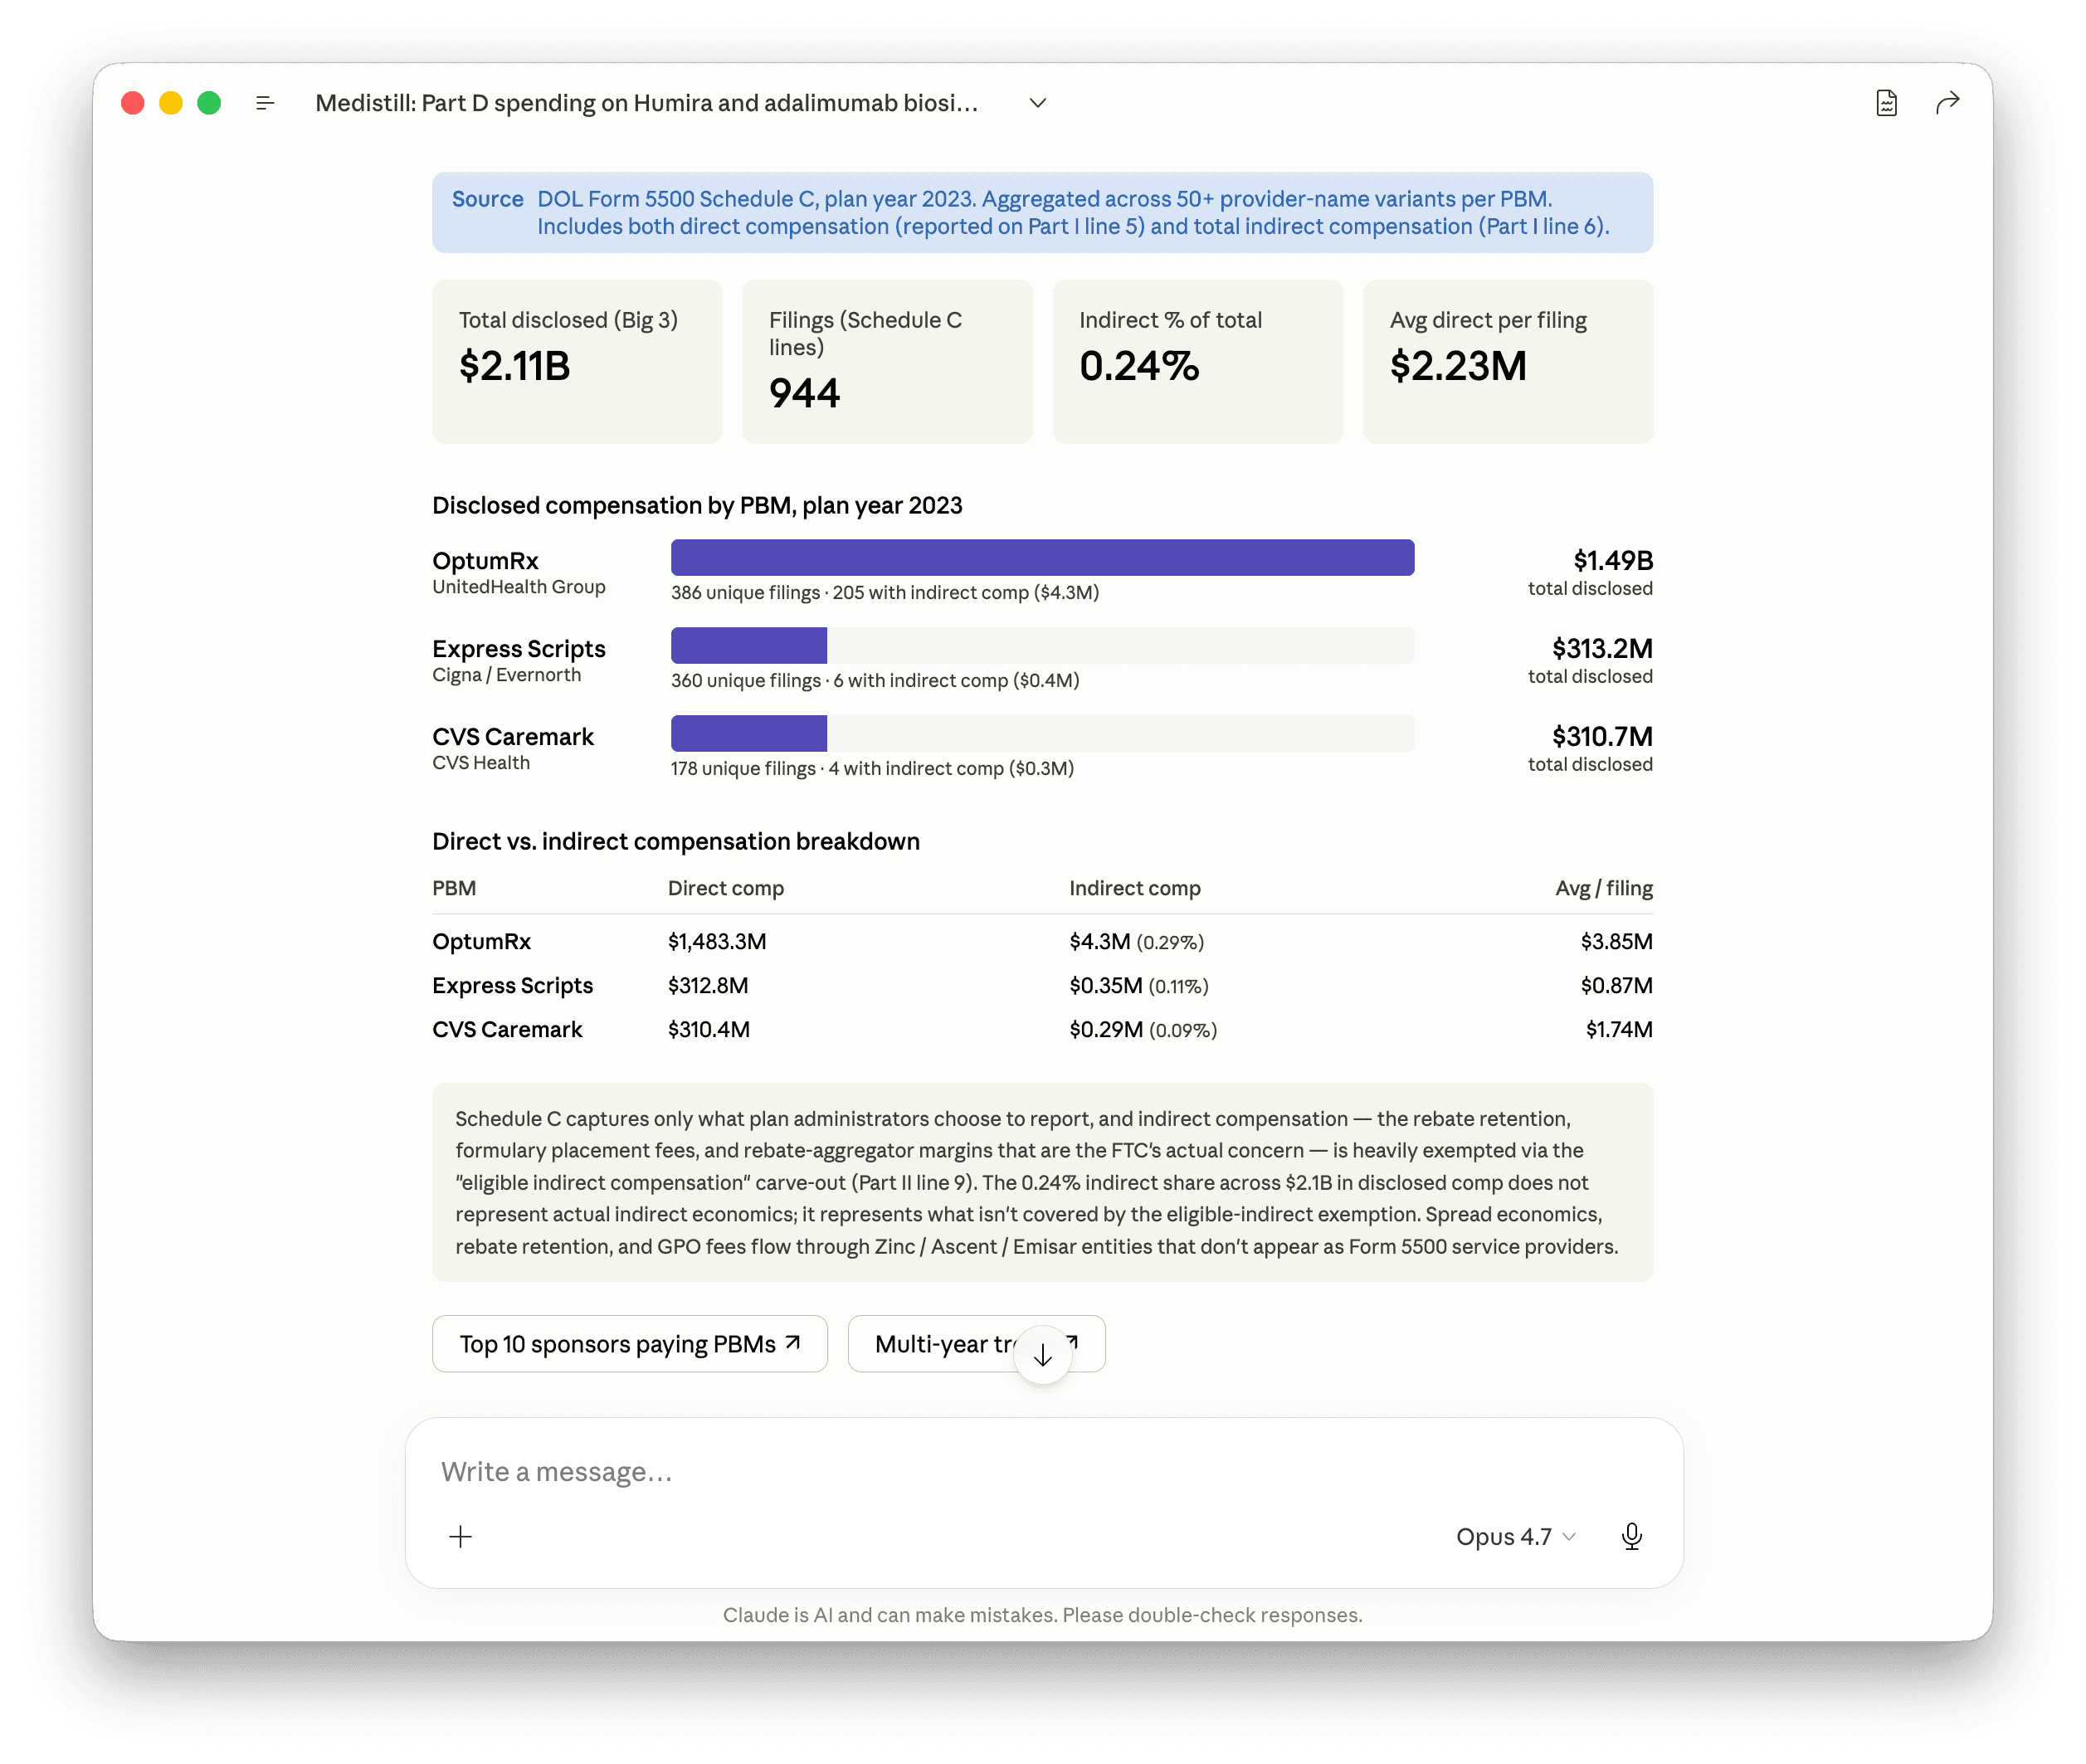
The skew between OptumRx and the other two is partially real and partially intercompany. UnitedHealth Group's own employer plans name OptumRx as the PBM service provider, so a meaningful chunk of OptumRx's $1.49B is UnitedHealth paying its own subsidiary. CVS Health and Cigna do the same with their own PBMs at smaller scale. Strip the intercompany volume and the three Big 3 numbers converge.
The carve-out is the more important point. Schedule C Part II line 9 exempts “eligible indirect compensation” from dollar-amount reporting if the plan administrator receives written disclosure of the fee's existence and method of calculation. Almost all PBM rebate retention, manufacturer administrative fees, and spread-pricing margins qualify for that exemption. The 0.24 percent indirect share isn't a measure of how little indirect compensation exists. It's a measure of what wasn't exempted.
For an order-of-magnitude calibration: the FTC's January 2025 second interim staff report estimated $7.3B in specialty-generic markup revenue alone at the Big 3 PBMs from 2017 through 2022. None of that $7.3B appears on Schedule C. It flows through rebate aggregators (Zinc Health Services for Caremark, Ascent Health Services for Express Scripts, Emisar Pharma Services for OptumRx) and private-label biosimilar subsidiaries (Cordavis, Quallent, Nuvaila), none of which appear as Form 5500 service providers. The $2.11B floor is what the disclosure regime captures. Multiply by 3x to 5x for an honest read of total economic compensation.
The 19.2 percent biosimilar share in Part D Q3 2025 is what happens when the rebate stack on a single drug becomes more expensive to defend than to surrender. The Schedule C $2.11B floor is what the same actors are still extracting from every other drug where the surrender hasn't happened yet.
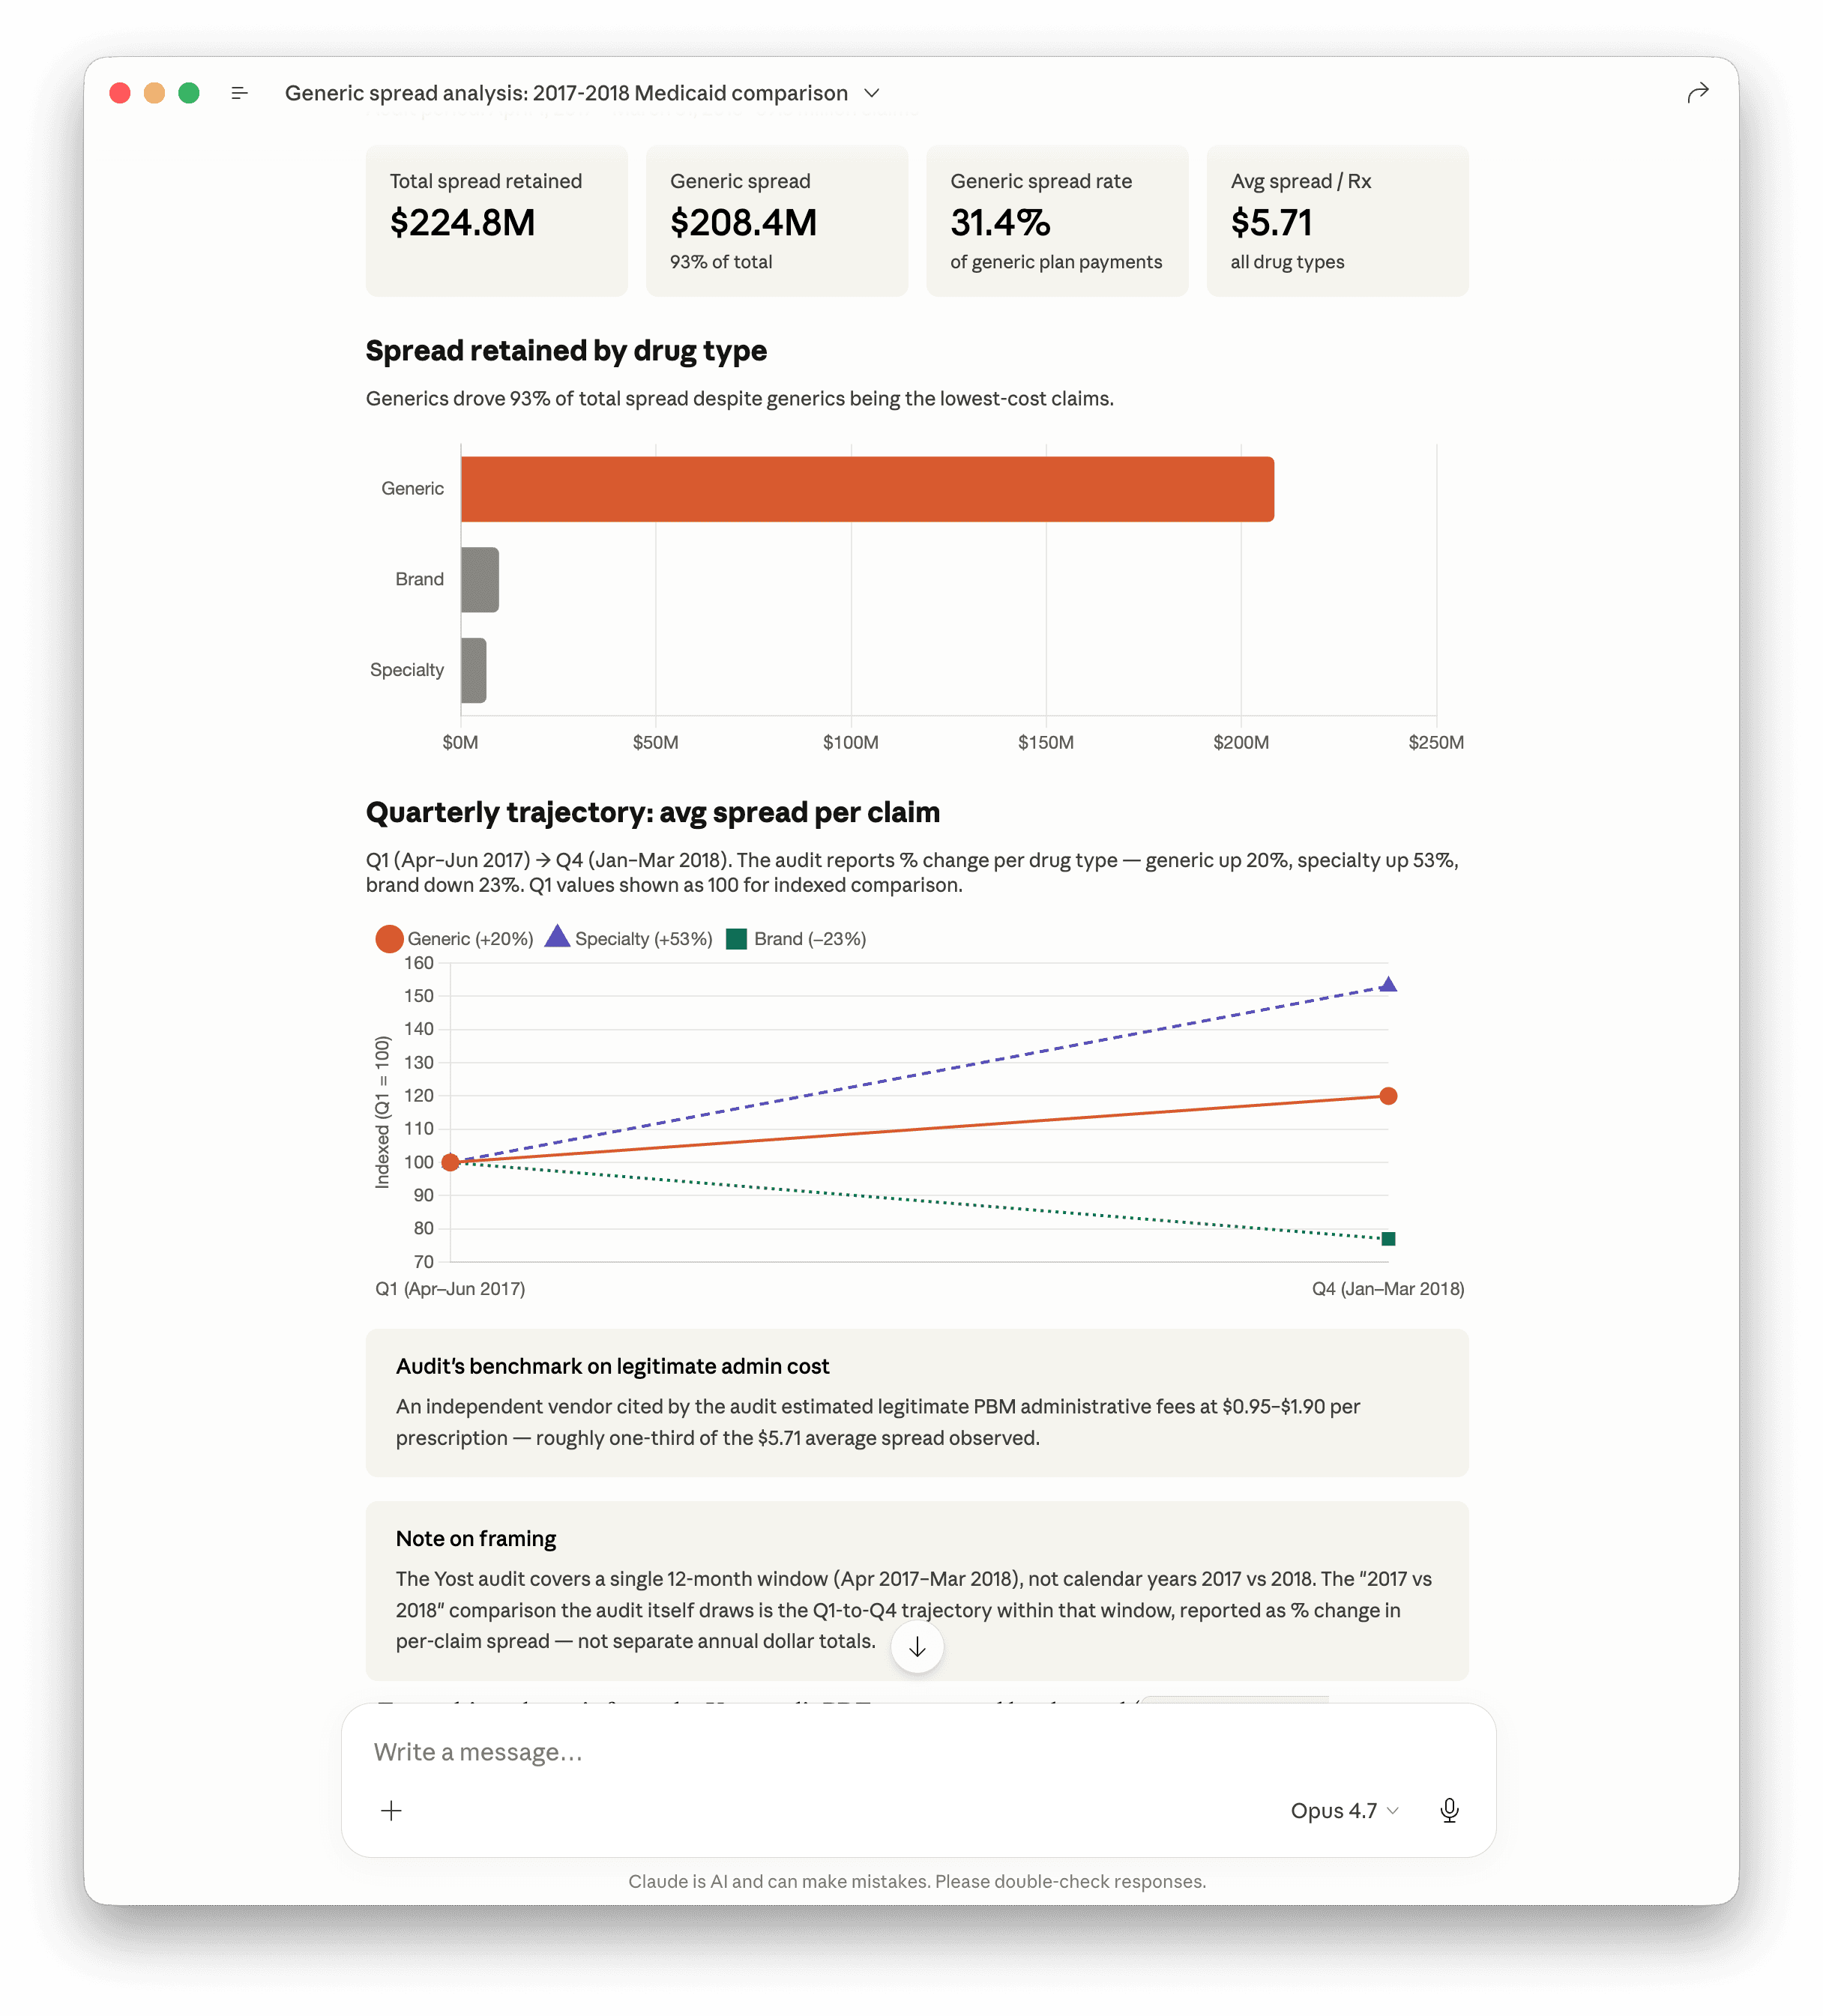
Ohio's State Auditor said the quiet part out loud in 2018. The OAS audit covered twelve months of Medicaid managed-care PBM claims (April 2017 through March 2018, 39.3 million prescriptions). The PBM retained $224.8 million in spread over that window. Ninety-three percent of it came from generic drugs, where the spread rate ran 31.4 percent of plan payments. Per prescription that's $5.71 in PBM margin against an independent vendor's benchmark of $0.95 to $1.90 for legitimate administrative cost. Roughly three-to-six times the defensible number, on each prescription, by a state auditor's reckoning, in writing.
Inside the audit window the trajectory got worse, not better. Quarter one to quarter four, generic spread per claim was up 20 percent. Specialty spread up 53 percent. Branded came down 23 percent. The mix shifts toward what the PBM keeps the most margin on, in real time, while everyone in the contract is watching.
Prompt 6.5:
> Yost's 2018 OH Medicaid PBM audit. Pull the generic-spread numbers, 2017 versus 2018, plus the dollar figure on total spread retention. Two bars with the magnitude called out.
The Humira curve is the optimistic case. The pessimistic case is every Stelara, every Eylea, every Enbrel, every high-spend specialty drug where the formulary is still gated and the rebate stack is still intact. The Ohio audit is the case where someone with subpoena power asked the question and got the answer.
What's coming
Prompt 7:
> Which biosimilars launched in 2025? For each, pull the Part D Q1-Q3 2025 share trajectory.
Five ustekinumab biosimilars (Stelara reference) and three denosumab biosimilars (Prolia and Xgeva reference) launched in calendar year 2025. Two late-2024 launches (Tyenne for tocilizumab, Zymfentra for subcutaneous infliximab) entered their first full scaling year. Enbrel patents extend to 2029 and remain protected. The Stelara curve is the cleanest direct comparison to the Humira playbook because of the molecule's scale and the simultaneous entry of multiple biosimilars at LOE.
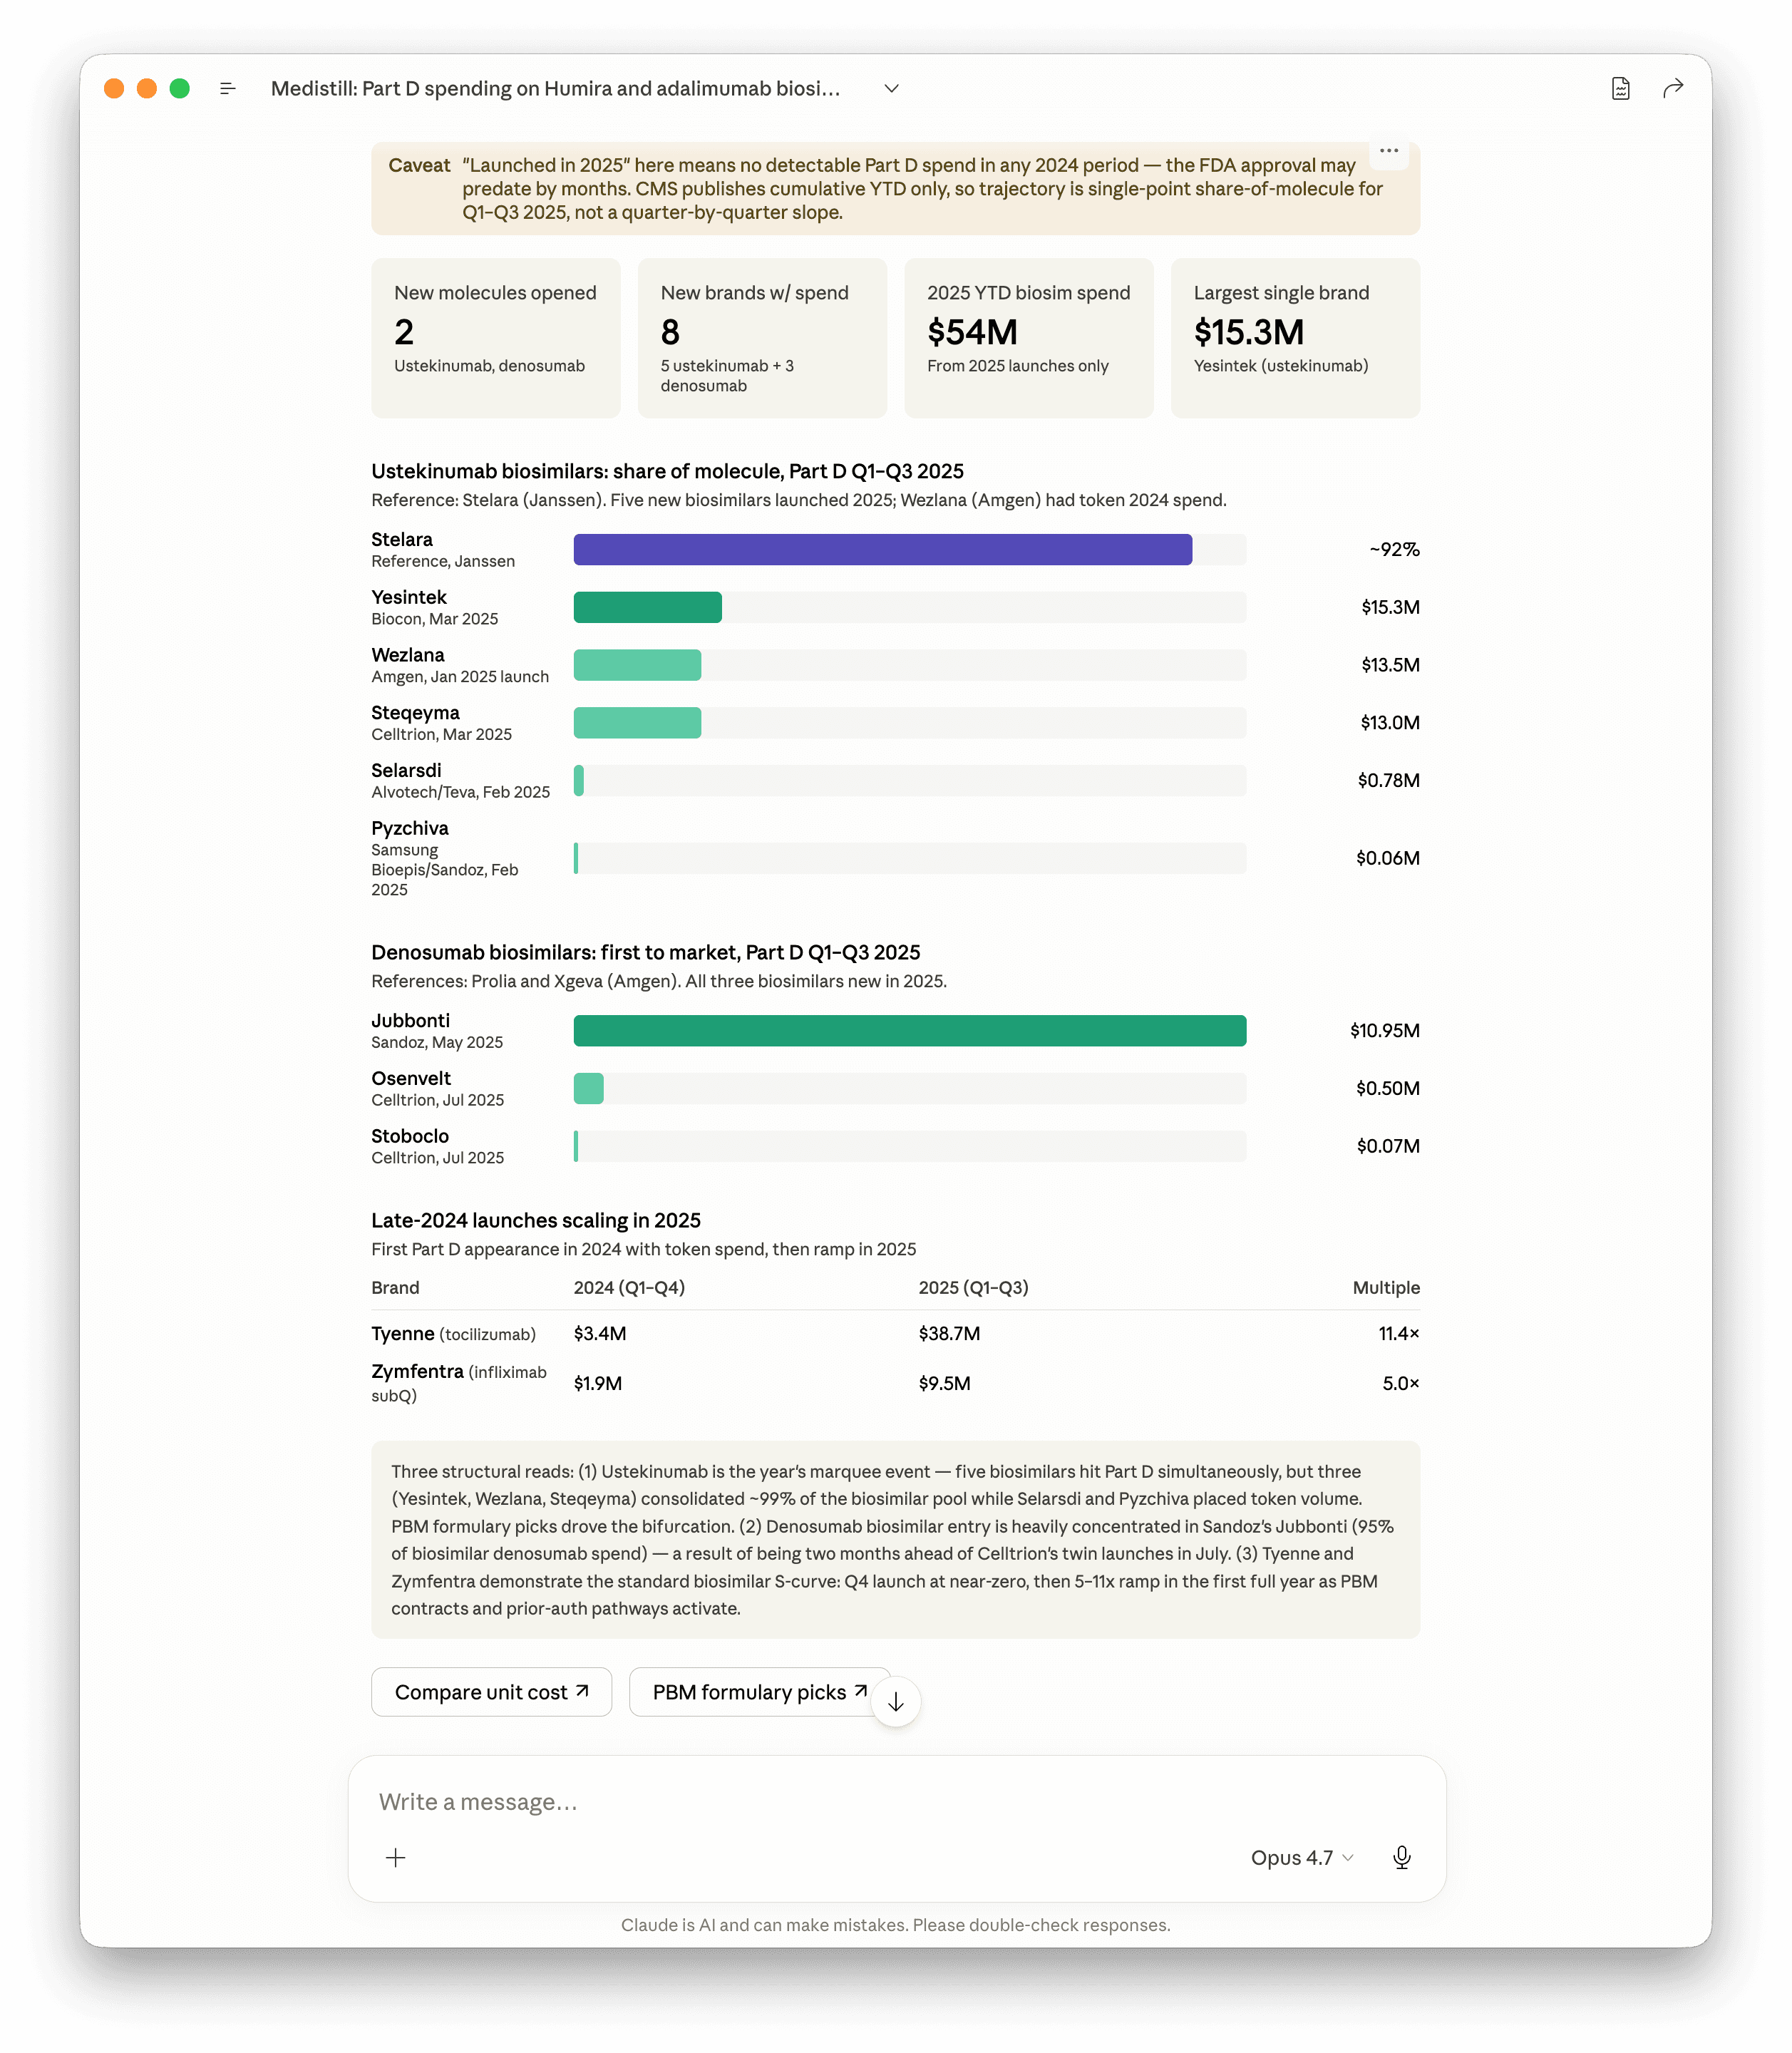
The early data falsifies one prediction and confirms another. Stelara biosimilars are at roughly 8 percent spend share six to nine months post-launch. Humira biosimilars were at 0.77 percent spend share at the same point. Adoption is roughly ten times faster on the dollar side, even before the post-2024 PBM environment fully settles. The eighteen-month flat line is not repeating.
What is repeating is the bifurcation pattern. Three of the five ustekinumab biosimilars (Yesintek from Biocon, Wezlana from Amgen, Steqeyma from Celltrion) captured approximately 99 percent of the biosimilar pool. Two (Selarsdi from Alvotech and Teva, Pyzchiva from Samsung Bioepis and Sandoz) placed token volume. PBM formulary picks drove the bifurcation. The denosumab segment shows the same pattern more starkly: Sandoz's Jubbonti captured 95 percent of biosimilar denosumab spend by being two months ahead of the Celltrion twins (Osenvelt and Stoboclo). Same rebate-machine-restructuring dynamic the adalimumab section described, observable in the next molecule cohort in real time.
Tyenne (tocilizumab biosimilar) and Zymfentra (infliximab subcutaneous) demonstrate the standard biosimilar S-curve when the launch happened pre-pivot rather than into the new environment. Q4 2024 launch at near-zero, then 5x and 11x ramps in the first full year as PBM contracts and prior-authorization pathways activated. Three molecule cohorts, three different curve shapes, all readable in the same Part D quarterly dataset.
The CMS Part D quarterly file is, as of this writing, the cleanest dataset available for tracking PBM rebate dynamics. Schedule C is annual and lagged. Manufacturer net pricing is private. Commercial claims are dark. Part D quarterly is the single window where formulary moves can be observed close to real time.
This blog will be updated as Q4 2025 publishes (CMS expected April 2026) and Q1 2026 follows (expected July 2026). The Stelara and denosumab curves we're tracking now will get their first full-year readings in those releases. The hypothesis to test: does the bifurcation pattern hold (three winners and a long tail) or does the interchangeable-status biosimilar pull ahead the way Cyltezo did in adalimumab?
Closing
The point of the exercise isn't to indict an industry. The Big 3 PBMs are responding rationally to the incentive structure they were built inside. Demanding moral retreat from a profit-maximizing intermediary is not a strategy.
The point is that the incentive structure produced an eighteen-month delay in the adoption of FDA-approved alternatives that price at a fraction of branded list, and that the delay cost plan sponsors and beneficiaries in the multi-billion-dollar range on Humira alone. That cost is recoverable. The recovery requires plan sponsors to read their own Schedule C disclosures, ask harder formulary questions, and run the comparison the way Cost Plus has been running it.
Claude with Medistill makes the research a thirty-minute exercise instead of a six-week consulting engagement. Every query above runs in seconds. The receipts have been there the whole time. The unlock is being able to ask the question and get a defensible answer back without a data team.
Cost Plus was right. The State of Ohio said the same thing in 2018. The data backs them both.
Update, May 18
Three pieces of evidence landed in Medistill this week that extend the thesis above without changing a number in the Humira chart.
First, the Ohio Auditor's 2018 PBM audit is now indexed as structured findings rather than a 96-page PDF. The headline: $5.71 in PBM margin per prescription against an independent vendor's benchmark of $0.95 to $1.90 for legitimate administrative cost. Three-to-six times the defensible number, signed by a state auditor. $224.8 million retained over twelve months on a single state Medicaid book.
Second, a state PBM transparency-law tracker covering 3,345 bills across 52 jurisdictions is now queryable. Plan sponsors can see, in seconds, whether their state requires spread-pricing disclosure, MAC list governance, or rebate pass-through. Most don't yet.
Third, the Cost Plus formula is now a reproducible comparison. Pull any NADAC drug, apply Cost Plus's own posted markup logic, see the result next to the Medicare Part D weighted-average spend. The same math anyone can run, returned in a single response.
Prompt 8:
> Where are the widest Part D versus NADAC spreads right now? Top 10 generics. Skip penny drugs, anything starting under a dollar.
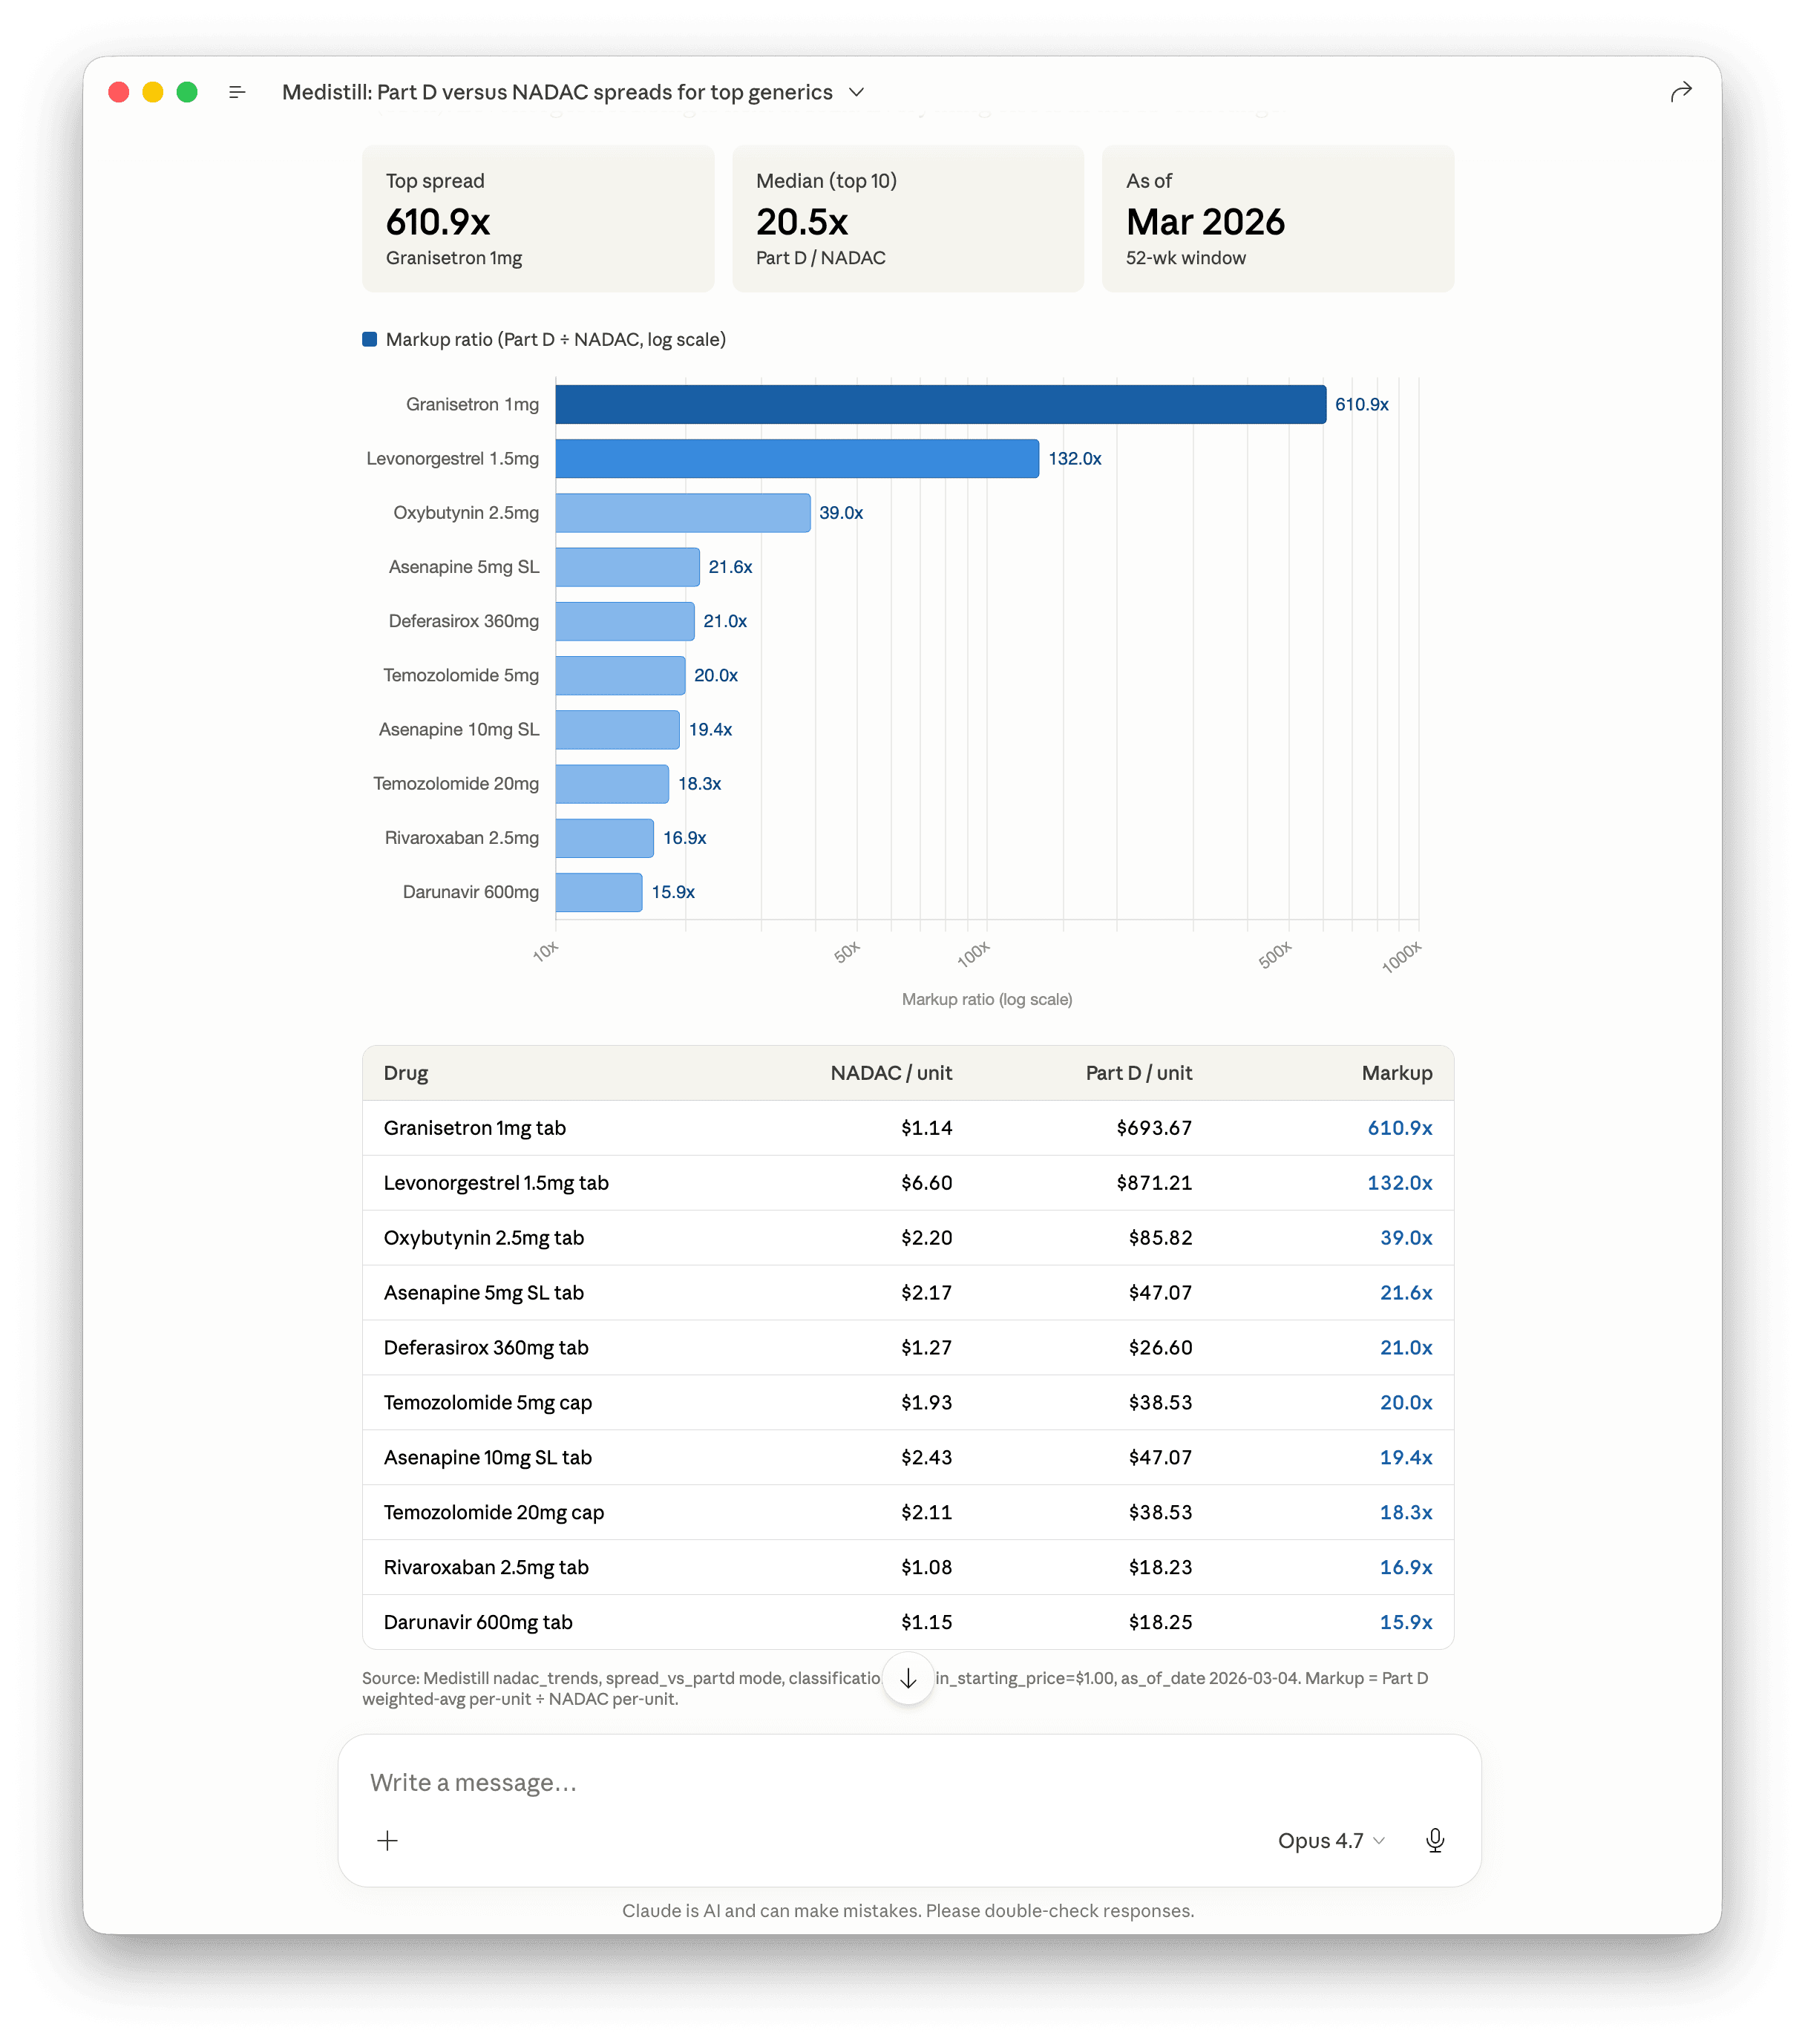
Run it on your own cohort
This post took thirty minutes. Bring your own employer cohort, drug list, or PBM target — same dataset, same response time. Every prompt above runs in Claude with the Medistill connector. Free 50 free credits, full access, cancel anytime.
from $199/month, Cancel anytime. 2,000+ healthcare datasets, queryable in plain English.